


Impressions tell you how much advertising was delivered. Outcomes tell you what the delivery changed. If you are a CMO, a retailer building a media business or a PE portfolio operator deciding where the next dollar goes, the useful habit is to report both, but to make budget decisions on outcomes, and specifically on incremental outcomes: the sales or customers that would not have happened without the ad. At Kontrol Media we build and operate retail and commerce media networks, and the measurement conversation is where most of those programs are won or lost.
TL;DR
- An impression is a delivery count. It shows the volume of inventory served, not whether anyone noticed, remembered or bought.
- Clicks are a weak bridge to sales: research from Nielsen and NYU found that clicks and buyers often do not line up.
- Attribution assigns credit to an outcome after the fact. Incrementality tests whether the ad caused it, using a holdout group.
- Retail and commerce media networks should report impressions, engagement and conversions in one glossary, with attribution windows and comparison groups stated.
- Keep impressions as a diagnostic for reach and pacing, and judge the campaign on incremental revenue per dollar.
Table of Contents
- What an impression actually counts
- The measurement ladder: from impression to incremental outcome
- Why clicks are not the bridge to sales
- Attribution is not incrementality
- How to run an outcome test that holds up
- Measuring outcomes in retail and commerce media
- Where impressions still earn their place
- Our perspective
- Turning measurement into growth
- FAQ
- Sources
What an impression actually counts
An impression is one instance of an ad being delivered. The industry definition, as summarized in the IAB Europe retail media measurement standards, is an ad that has been successfully delivered to a device and has begun to render, which does not mean the person saw it. The ad may have loaded on a part of a page the shopper never scrolled to.
Google Ads Help makes the same point from the awareness side: impressions show how many people laid eyes on your ad, and you may not care whether they bought right then, as long as they remember your brand. That is a legitimate goal, but it is a different goal from revenue, and the two should never share a single number on a dashboard.
A viewable impression is stricter. Under the standard that Digital Marketing Institute describes, half the ad must be visible for more than one second. It raises confidence that the ad had a chance to be seen. It still measures a chance, not a result.
The measurement ladder: from impression to incremental outcome
The confusion between impressions and outcomes usually comes from treating a chain of different measurements as one. The Advertising Club of New York lays out the layers well: reach, frequency and viewability establish whether consumers had an opportunity to encounter a message; attention indicates whether that opportunity registered; brand measures capture shifts in awareness or perception; sales and conversions reflect behavior; and incrementality addresses whether those outcomes were caused by the marketing.
Here is how I would put it on one page for a leadership team.
| Layer | What it answers | Example metric | What it cannot tell you |
|---|---|---|---|
| Delivery | How much did we serve? | Impressions, reach, frequency | Whether anyone noticed |
| Opportunity | Could it be seen? | Viewable impressions | Whether it registered |
| Engagement | Did anyone interact? | Clicks, CTR, video plays | Whether clickers become buyers |
| Outcome | Did a business action follow? | Orders, revenue, leads, add to cart | Whether the ad caused it |
| Incremental outcome | What would not have happened without the ad? | Incremental conversions, cost per incremental conversion | Nothing further on causation, but it needs a test design |
The CIMM report on outcomes measurement draws the line most teams miss. Linking an exposure to a later search, visit or purchase establishes an association. Attribution can assign credit for that outcome. Establishing incrementality requires a credible estimate of what would otherwise have happened.
Why clicks are not the bridge to sales
Many teams treat the click as the compromise: it is closer to a sale than an impression, and it is easy to count. The evidence says the compromise is weaker than it looks.
Nielsen’s 2014 study of online advertising return covered 12 major brands, 1.5 billion Facebook impressions, 600 million Google search impressions and $2 billion in sales across 5,000 US grocery, drug and mass merchandisers. With click-through rates often below 1 percent, it found that clicks were not a good indicator of incremental sales, while delivered impressions were much more predictive of sales lift. An earlier Nielsen study from 2011 found that a campaign’s click-through rate showed no connection to sales lift.
An NYU Stern working paper reached a related conclusion across a large number of campaigns: clicks are poor proxies for evaluation and optimization because buyers do not resemble clickers. Visits to the brand’s website worked far better as a proxy for who would purchase.
The practical consequence is that a high click-through rate can send you in the wrong direction. Search Engine Journal argued in June 2026 that CTR has moved from a primary success metric to a diagnostic indicator, and that with automated bidding marketers should judge campaigns on the quality of actions after the click.
Notice what this does and does not say. It does not say impressions are worthless. The Nielsen finding is that delivered exposure carried more signal about sales lift than clicks did. The message is to stop using the click as a stand-in for the outcome and measure the outcome directly.
Attribution is not incrementality
Once you track outcomes, the next trap is believing that every purchase that follows an ad was caused by it. A view-through, or post-impression, conversion is recorded when someone sees an ad, does not click, and later converts through another route such as organic search or email, as the Digital Marketing Institute lesson explains. Useful, but a shopper who was already going to buy will show up in that column too.
The IAB’s November 2025 guidelines for incremental measurement in commerce media define incrementality as the additional business outcomes directly driven by a campaign compared with what would have happened without it. They also state that a credible counterfactual is the main factor behind the causal strength of any model. Without one, measured differences may reflect correlation.
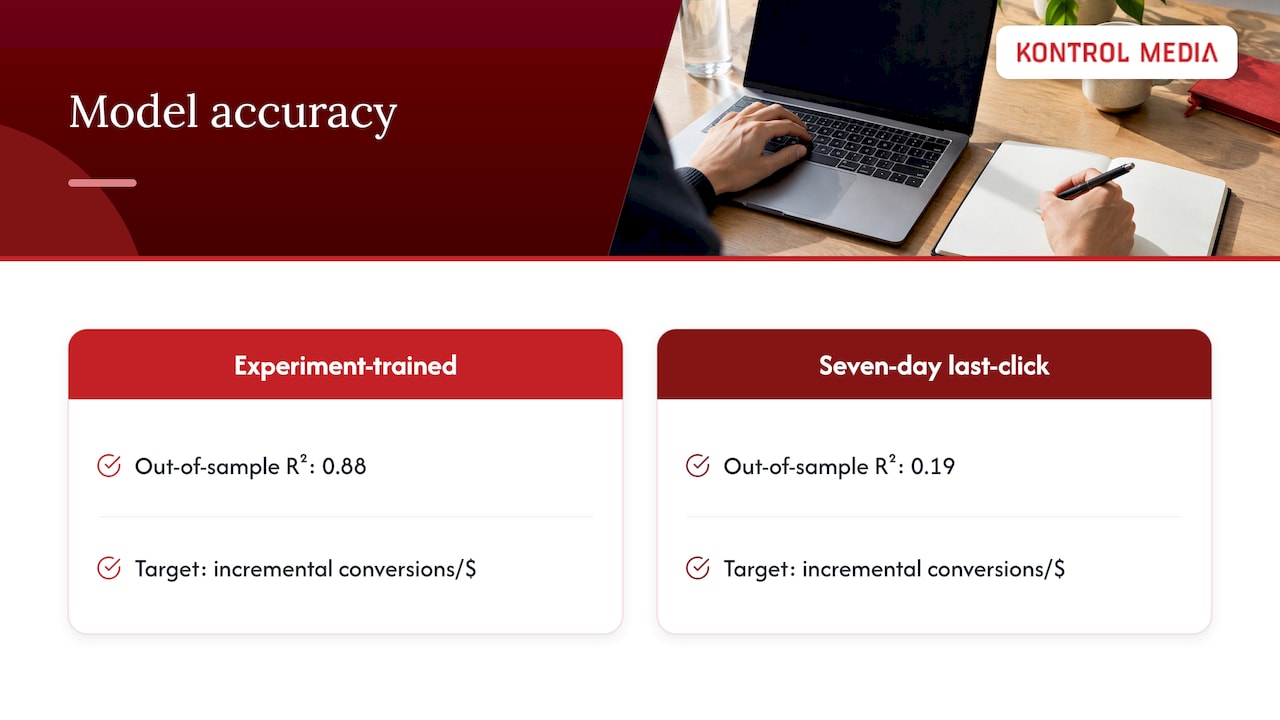
The gap is not academic. Gordon, Moakler and Zettelmeyer, in a Management Science paper built on 2,226 Meta ad experiments, found that their experiment-trained model reached an out-of-sample R-squared of 0.88 for incremental conversions per dollar, against 0.19 for seven-day last-click attribution. Put plainly, the standard attribution report explained very little of what the ads actually caused.
How to run an outcome test that holds up
The IAB guidelines list the main designs: randomized control groups, holdouts or ghost ads, matched markets for geographic tests, and synthetic control groups. For most mid-market teams the routine looks like this.
- Name the outcome before launch. Pick a business action: incremental revenue, new customers, qualified leads. Write down how it will be counted and from which system. Impression and click counts stay in the report as diagnostics.
- Define the audience and split it. Divide a defined audience into an exposed group and a holdout that is eligible to see the ad but does not. Where it goes wrong: splitting by convenience (the loyal customers get the ads) rather than at random, which bakes the answer into the design.
- Hold the setup steady. Keep budget, creative and flight dates consistent between groups. Changing bids mid-test muddies the comparison.
- Compare conversion rates. The difference between the groups gives you incremental conversions and incremental revenue. Divide spend by incremental conversions to get the cost per incremental conversion.
- Expect a less flattering number than the dashboard. The cost per incremental conversion is often significantly higher than the cost per conversion an attribution model reports, according to Cometly’s testing guide. That is the point of the test: it removes the buyers you would have won anyway.
- Use viewability thoughtfully. The Media Rating Council standards say a base of viewable impressions is generally required for attributing outcomes to exposures, but holdout experiments may not need direct viewability filters, since a control user has no opportunity to see an ad and there is nothing to filter.
Because tests take time and budget, run them on the programs that matter most and use the results to calibrate everyday reporting. Our write-ups on incrementality in retail media and on a growth marketing experimentation framework go deeper on test design.
Measuring outcomes in retail and commerce media
Retail and commerce media networks have an advantage that most advertisers lack: the transaction data sits next to the ad. That makes it possible to report purchases, not just exposure, and to do it online and in store.
Tractor Supply’s retail media measurement glossary shows a clean way to organize it. Awareness metrics cover impressions, viewable impressions, reach and frequency. Engagement metrics cover clicks, CTR, engagement rate and video plays. Conversion metrics cover transactions, orders, units sold, conversion rate, revenue, attributed sales online and in store, add to cart and cart conversion. Three families, defined once, so an advertiser can read a report without a decoder ring. Our guide to key retail media metrics follows the same logic.
There is one caution that matters to anyone selling or buying inventory. The Advertising Club of New York reports that ARF research on retail media networks has found substantial variation in attribution windows, comparison groups, definitions and reporting practices. Two dashboards can look comparable and rest on very different assumptions. For a network operator, that means publishing your windows and your control methodology with every report. For a brand, it means asking each network the same questions before comparing results.
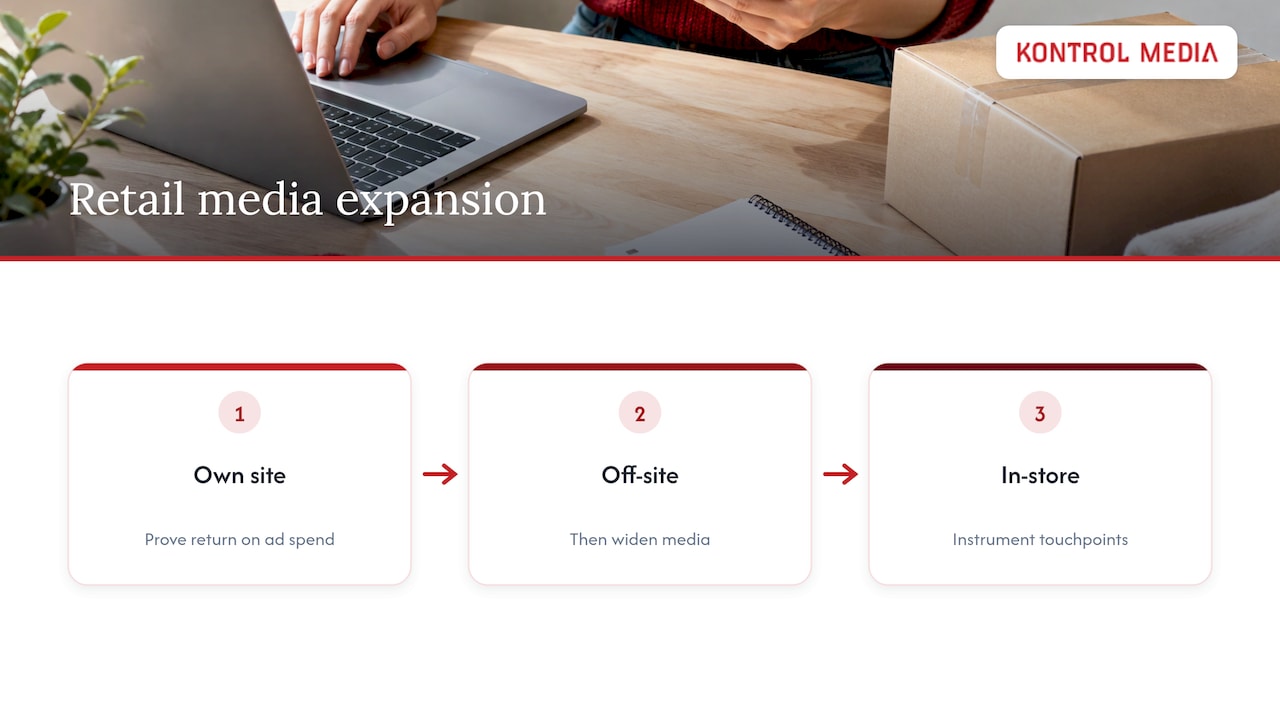
Sequence matters too. We generally argue that retailers should prove return on ad spend on their own site first, then widen to off-site media, which we cover in onsite versus offsite retail media. In-store media adds another layer, and our piece on measuring in-store retail media covers the touchpoints to instrument.
If you manage a channel of agents, dealers or franchisees, the same discipline applies to what each partner does with your co-op funds. This marketing dashboard guide for channel leaders separates impression opportunity, attention and behavioral response in campaign evaluation, which is a useful frame for partner-level reporting.
Where impressions still earn their place
Impressions belong in the report. They tell you how much inventory you bought and how much of it was served, which is a prerequisite for everything downstream. They also help you spot pacing problems, saturation and frequency that climbs too high. The Ad Club notes that attention may build, decline or change across repeated exposures, so frequency deserves its own line rather than being buried in a total.
The Search Engine Land guide is a good reminder of the arithmetic: impressions are typically higher than reach, which is usually greater than clicks. Treat the funnel as a series of different measurements, each with its own denominator, and never divide one by another without saying why.
A simple rule of thumb: use impressions to ask whether the campaign ran as planned, and use incremental outcomes to ask whether it was worth running. For the broader question of return across channels, see our guide to measuring the ROI of marketing and advertising campaigns, and for the cultural side of the shift, driving revenue, not clicks through partnerships.
Our perspective
I have sat in enough quarterly reviews to know how this goes. A slide shows a few hundred million impressions, a respectable click rate and a hopeful arrow, and the room nods. Then someone from finance asks what it did to revenue, and the room gets quiet.
The fix is rarely a better impression report. It is agreeing, before the campaign launches, on the business outcome that will decide whether it continues, and building the test that can prove it. In retail and commerce media that is easier than anywhere else, because the sale happens inside the network’s own data. In the real estate channel, where we help brands reach home buyers and homeowners through agents, the same principle holds: the question is how many movers a partnership actually moved, not how many emails were opened.
We work with PE portfolio companies, middle market companies and large enterprises, and what we hear underneath most measurement questions is a wish for permission to be honest. A holdout test gives you that permission. The number is sometimes smaller than the dashboard promised, but it is a number you can plan a budget around, and it is what lets a network sell advertisers on repeat spend.
Our job is to build the strategy and then do the work with you: set up the network, operate it, run the partnerships, and make the reporting something a CFO would sign.
Mark Kapczynski
Turning measurement into growth
If you are standing up a network or trying to lift ad revenue from one, measurement design is part of the build, not an afterthought. Kontrol Media helps retailers and consumer businesses stand up a retail or commerce media network and handles retail media network operations once it is live, alongside business strategy, marketing and sales execution through our services.

Brands that want to reach home buyers and homeowners can explore our real estate channel programs, which include media partnerships and agent-based email and ad programs.
FAQ
Are clicks or impressions more important?
Neither is the end goal. Nielsen’s 2014 research found delivered impressions more predictive of sales lift than clicks when click-through rates sit below 1 percent. Use both as diagnostics and judge the campaign on incremental sales, revenue or new customers.
What is the difference between an impression and a viewable impression?
An impression means the ad was delivered and began to render. A viewable impression adds a visibility rule: under the standard described by Digital Marketing Institute, half the ad must be visible for more than one second. Both measure an opportunity to see, not confirmed attention.
Is attribution the same as incrementality?
No. Attribution assigns credit for an outcome to an ad exposure, often using a rule such as last click. Incrementality asks what would have happened without the ad, and answers it with a test that includes a holdout or other credible counterfactual.
How do retailers measure outcomes alongside impressions?
They report awareness, engagement and conversion metrics in a single defined glossary, state the attribution window and comparison group, and run holdout tests on priority campaigns. Because retail media networks vary in definitions, publishing these choices with every report keeps results comparable.
Sources
- IAB Europe Retail Media Measurement Standards 2024
- Measuring brand awareness, Google Ads Help
- Display Advertising Metrics, Digital Marketing Institute
- Measuring What Matters, The Advertising Club of New York
- Measuring What Advertising Changes, CIMM
- The Billion Dollar Question, Nielsen (2014)
- Online brand metrics and offline sales, Nielsen (2011)
- Evaluating and Optimizing Online Advertising, NYU Stern
- Why a Sky-High CTR Does Not Mean Your Ads Are Working, Search Engine Journal
- Guidelines for Incremental Measurement in Commerce Media, IAB
- Predicted Incrementality by Experimentation, Management Science
- Digital Audience-Based Measurement Standards, Media Rating Council
- Retail Media Measurement Glossary, Tractor Supply
- What is an ad impression, Search Engine Land
- What Is Incrementality Testing, Cometly
- Marketing Dashboard Guide for Channel Leaders