

Key metrics for retail media are quantifiable performance indicators that measure the incremental impact and overall effectiveness of retail advertising campaigns. In 2026, the industry has moved well past simply counting clicks and impressions. Metrics like Return on Ad Spend (ROAS), incremental ROAS (iROAS), Cost Per Click (CPC), and investment rate now define how seriously a brand or network takes its measurement practice. Tools from CommerceIQ, SellerApp, and data from eMarketer have made tracking these indicators more accessible, yet the real challenge is not data availability. It is methodology. Getting these numbers right is what separates campaigns that genuinely grow a business from those that just look good on a dashboard.
What are the most important metrics for retail media campaigns?
The primary retail media KPIs tracked monthly or quarterly include Amazon ROAS, CPC, ecommerce attributed sales growth, and ecommerce attributed spend growth. These four form the operational backbone of most retail media reporting. They tell you how efficiently your ad dollars are converting, how much your sales base is growing as a result of advertising, and what you are paying for each consumer action.
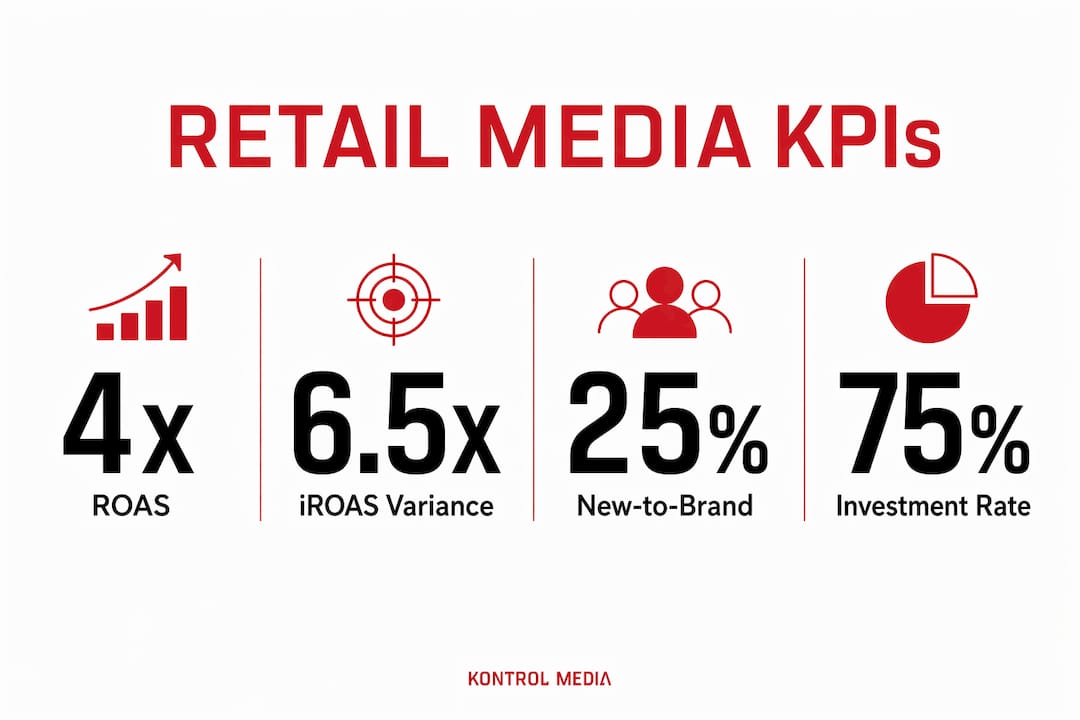
ROAS measures total attributed revenue divided by total ad spend. A ROAS of 4x means every dollar spent returned four in attributed sales. CPC tells you the cost of each click on a sponsored product or display unit, which directly informs bidding strategy and keyword prioritization. Ecommerce attributed sales growth tracks whether your overall sales volume is expanding in correlation with your media investment, while attributed spend growth shows whether your advertising budget is scaling in proportion to your category opportunity.

Beyond these four, retail media performance metrics worth tracking include sales lift, customer engagement rate, new-to-brand customer percentage, and share of voice within a category. Sales lift measures the difference in purchase behavior between exposed and unexposed shoppers. New-to-brand percentage is particularly telling because it reveals whether your ads are genuinely expanding your customer base or simply retargeting existing buyers at a premium.
| Metric | Definition | Primary use case |
|---|---|---|
| ROAS | Revenue attributed to ads divided by ad spend | Budget efficiency and channel comparison |
| CPC | Cost paid per click on an ad unit | Bid optimization and keyword strategy |
| Sales lift | Incremental sales driven by ad exposure | Proving true campaign impact |
| New-to-brand % | Share of buyers who are first-time purchasers | Audience growth and acquisition tracking |
| Investment rate | Percentage of active brands spending on the platform | Platform health and advertiser adoption |
Each of these metrics answers a different business question. Relying on only one, especially blended ROAS, produces a distorted picture of what your retail media investment is actually doing.
Why incrementality and methodology transparency matter in 2026
Incrementality is defined as the additional sales or conversions that would not have occurred without the advertising exposure. It is the difference between correlation and causation in retail media measurement, and it is the metric the industry is most urgently trying to get right.
The problem is significant. iROAS results can vary 6.5x depending solely on the methodology used to calculate them, with 83% of campaigns flipping from positive to negative based on calculation method alone. That is not a minor rounding error. It means a campaign your platform reports as a strong performer could, under a different methodology, be destroying margin. This variability is the central measurement crisis in retail media today.
Retail media networks operate as closed ecosystems where reported metrics correlate with ad exposure rather than proving causation. This structural reality drives the need for outcomes-based measurement that tracks behavior change across all touchpoints, not just onsite efficiency numbers reported by the platform itself. Trusting a platform to grade its own homework has never been a sound strategy.
The confidence gap reflects this reality directly. Only 15% of brands express strong confidence in retail media measurement, yet 52% say better measurement would accelerate their investment. That gap represents an enormous amount of budget sitting on the sidelines, waiting for the industry to mature its methodology.
Sam’s Club’s Rest-of-Market Report offers a model worth studying. It uses real control groups with deterministic joins to produce iROAS net of organic baseline sales. This approach satisfies the three criteria a valid incrementality measurement requires: a real control group, a deterministic join between exposed and control individuals, and iROAS reported net of baseline organic sales. Any measurement missing one of these three elements produces numbers you cannot fully trust.
Pro Tip: Before accepting any iROAS figure from a retail media network, ask three questions: How was the control group constructed? What matching methodology was used? Are the reported sales increments net of organic baseline? If the network cannot answer all three clearly, treat the number as directional, not definitive.
“Most retail media brands are less challenged by data availability than by data methodology, requiring a shift from quantity of data to quality and transparency.” — Retail Media Has Reached Its Accountability Moment
How do investment rate and monetization rate measure platform health?
Investment rate and monetization rate are two distinct performance indicators for retail media networks that measure very different things, and confusing them leads to poor strategic decisions.
Investment rate measures the percentage of active brands currently spending on a retail media platform. It is considered the north star metric for retail media program health because it reflects current advertiser adoption and the sustainability of the network’s ad load. A high investment rate means many brands are participating, which spreads ad load across more products, increases product relevance for shoppers, and supports healthier Total Advertising Cost of Sales (TACOS) across the platform.
Monetization rate, by contrast, measures the revenue a network has already generated relative to its gross merchandise value. It is a backward-looking snapshot of past revenue performance. Monetization rate tells you where the network has been. Investment rate tells you where it is going.
| Metric | What it measures | Time orientation | Strategic signal |
|---|---|---|---|
| Investment rate | % of active brands spending on the platform | Forward-looking | Advertiser adoption and program sustainability |
| Monetization rate | Ad revenue as % of GMV | Backward-looking | Historical revenue efficiency |
Retail media network sustainability depends on a high investment rate because broad brand participation reduces concentration risk. When only a handful of large brands fund a network’s ad revenue, the platform is fragile. When hundreds of brands participate at varying spend levels, the network is structurally healthier and better positioned to scale. This also improves organic discoverability for smaller brands, since their products appear in relevant search results without requiring massive ad budgets to compete.
Pro Tip: If you are evaluating a retail media network as an advertiser or a potential operator, ask for their investment rate trend over the past four quarters, not just their monetization rate. A rising investment rate signals a healthy, growing ecosystem. A stagnant or declining one signals consolidation risk.
How to apply retail media performance metrics to optimize your strategy
Applying performance indicators for retail media effectively requires more than pulling a weekly report. It requires a structured approach to interpreting what the numbers mean for your specific business objectives.
Start by separating media performance from business performance. Differentiating platform efficiency from incremental revenue and margin is the foundational discipline that most brands skip. Your platform-reported ROAS may look strong while your contribution margin after ad spend is shrinking. These two things can coexist, and only tracking one of them leaves you flying partially blind.
A practical framework for measuring retail media effectiveness looks like this:
- Establish your baseline. Before launching or scaling a campaign, document your organic sales velocity, your new-to-brand customer rate, and your share of voice in the category. These are your control benchmarks.
- Track multiple efficiency metrics simultaneously. Marketing Efficiency Ratio (MER), ROAS, Customer Acquisition Cost (CAC), contribution margin after ad spend, and CAC payback period together provide a view that no single metric can offer alone.
- Request methodology documentation from your retail media network. Ask specifically how their iROAS is calculated, what their control group methodology is, and whether their attribution window aligns with your category’s purchase cycle.
- Run incrementality tests at regular intervals. Do not rely solely on always-on attribution. Periodic holdout tests give you a ground-truth read on whether your spend is driving genuine lift or simply capturing sales that would have happened organically.
- Tie metrics back to margin, not just revenue. A campaign with a 6x ROAS on a low-margin SKU may be less valuable than a 3x ROAS campaign on a high-margin product. Revenue attribution without margin context is an incomplete picture.
Common pitfalls include overreliance on blended ROAS across all campaigns and SKUs, ignoring contribution margin entirely, and accepting platform-reported numbers without asking how they were produced. Real-time tracking tools like CommerceIQ and Pacvue can surface anomalies faster, but they do not replace the discipline of asking hard questions about the underlying methodology.
Pro Tip: Build a simple scorecard that tracks ROAS, iROAS, new-to-brand percentage, and contribution margin after ad spend side by side for every campaign. When these four numbers move in the same direction, you have a genuinely healthy campaign. When they diverge, you have a signal worth investigating.
Key takeaways
Effective retail media measurement requires tracking incrementality and margin alongside traditional ROAS, with methodology transparency as the non-negotiable foundation for confident budget decisions.
| Point | Details |
|---|---|
| Core KPIs to track | ROAS, CPC, sales lift, new-to-brand %, and investment rate form the essential measurement set. |
| Incrementality is non-negotiable | iROAS results vary 6.5x by methodology; always verify control group construction and baseline netting. |
| Investment rate over monetization rate | Investment rate is the forward-looking health signal for retail media networks; monetization rate is historical. |
| Separate media from business performance | Platform efficiency metrics and incremental revenue metrics answer different questions and must be tracked independently. |
| Methodology transparency drives investment | Only 15% of brands trust current measurement; demanding methodology clarity is the fastest path to confident budget growth. |
The measurement discipline most brands are still avoiding
I have spent a lot of time working with brands and networks on retail media strategy, and the pattern I keep seeing is the same one. A brand launches on a retail media network, the platform reports a strong ROAS, the team celebrates, and the budget scales. Then, six months later, someone asks why overall revenue growth has not kept pace with ad spend growth, and the room goes quiet.
The honest truth is that most brands are still measuring retail media the way they measured paid search in 2015. They are accepting platform-reported numbers at face value, conflating attributed sales with incremental sales, and optimizing toward metrics the platform controls rather than metrics the business controls. That is not a criticism of the platforms. It is a structural reality of closed ecosystems that report on their own performance.
What I find genuinely encouraging is that the industry is waking up to this. The conversation around incrementality testing, methodology transparency, and outcome-based measurement has matured considerably. Brands like Sam’s Club are publishing their measurement frameworks publicly, which raises the bar for everyone. The retail media ad sales conversation is shifting from “how much did we spend” to “what did we actually get.”
My advice is to get curious before you get comfortable. Ask your network partners the hard questions about methodology. Build your own incrementality testing cadence, even if it is simple. And track contribution margin alongside ROAS, because revenue without margin context is just a number that feels good until it does not.
The brands that will win in retail media over the next three years are not the ones with the biggest budgets. They are the ones with the clearest measurement discipline.
— Mark Kapczynski
How Kontrol Media can sharpen your retail media measurement
At Kontrol Media, we build, operate, and drive revenue for retail media and commerce media networks, and we have seen firsthand how measurement gaps translate directly into wasted budget and missed growth opportunities.

Whether you are a brand trying to understand what your retail media spend is actually producing or a network looking to build advertiser confidence through better reporting, Kontrol Media brings the strategic clarity and hands-on execution that moves the needle. We work with clients on incrementality testing frameworks, attribution methodology reviews, and retail media strategy that connects platform metrics to real business outcomes. We also help you measure campaign ROI with the rigor your budget decisions deserve. If you are ready to move beyond dashboard numbers and into genuine performance clarity, let’s talk.
FAQ
What are the key metrics for retail media campaigns?
The primary key metrics for retail media include ROAS, incremental ROAS (iROAS), CPC, sales lift, new-to-brand customer percentage, and investment rate. Together, these performance indicators cover both platform efficiency and true business impact.
How is incrementality different from ROAS in retail media?
ROAS measures total attributed revenue per dollar spent, while incrementality measures only the sales that would not have occurred without the ad exposure. iROAS is a more accurate indicator of genuine campaign value because it removes organic sales from the equation.
Why do iROAS results vary so much between platforms?
iROAS results can vary 6.5x based solely on methodology choices such as control group construction, matching techniques, and whether organic baseline sales are netted out. This variability makes methodology transparency a prerequisite for trusting any reported iROAS figure.
What is investment rate and why does it matter?
Investment rate measures the percentage of active brands spending on a retail media platform and serves as the north star metric for network health. A high investment rate signals broad advertiser adoption, healthier ad load distribution, and a more sustainable platform ecosystem.
How can brands improve confidence in retail media measurement?
Brands should request methodology documentation from their network partners, run periodic holdout tests, and track contribution margin alongside ROAS. Given that only 15% of brands currently express strong confidence in retail media measurement, demanding transparency is both a competitive advantage and a budget protection strategy.
Recommended
- Retail Media Ad Sales: Strategic Guide for Marketing Pros in 2026 | Kontrol Media Consultancy
- Retail Media Strategy for Non-Retailers: 2026 Guide | Kontrol Media Consultancy
- The Shift in Advertising Spend – How Retail Media Networks Are Changing the Game | Kontrol Media Consultancy
- Advertiser Acquisition Strategies for Media Networks in 2026 | Kontrol Media Consultancy