

iROAS, or incremental Return on Ad Spend, is defined as the revenue generated exclusively by advertising spend beyond what would have occurred through organic sales alone. For marketing professionals and data analysts working in retail media, understanding what iROAS measurement for retail media actually captures is the difference between making confident budget decisions and chasing a number that flatters your media partner more than it informs your strategy. Traditional ROAS counts every attributed sale. iROAS counts only the sales your ad actually caused. That distinction carries serious financial consequences, and the Albertsons Media Collective research published in 2026 makes the stakes concrete.
What is iROAS measurement for retail media?
iROAS is calculated using a deceptively simple formula: Incremental Revenue divided by Total Ad Spend. The complexity lives entirely in how you define and isolate incremental revenue, which is the revenue that would not have happened without the ad.
The standard method uses an incrementality test with two groups:
- An exposed group that sees the retail media ad during the campaign window.
- A holdout control group that is withheld from seeing the ad, representing organic purchase behavior.
The difference in conversion rates between those two groups produces the incremental lift. From there, you multiply the lift by average order value and total exposed audience size to arrive at incremental revenue. As one incrementality testing example illustrates, a campaign showing a 4.2% conversion rate in the exposed group versus 3.8% in the holdout group yields an incremental lift of roughly 10.5%. If the reported ROAS on that same campaign is 3.8x, the iROAS after holdout analysis may land at just 1.6x. That gap is not a rounding error. It represents the organic sales your brand would have captured anyway, now being credited to your ad spend.
Two more advanced methods are worth knowing:
- Bayesian Structural Time Series (BSTS): Models the counterfactual sales trend using pre-campaign data to estimate what sales would have been without the ad. This approach is particularly useful when a clean holdout group is difficult to construct.
- Propensity score matching: Statistically matches exposed shoppers to similar unexposed shoppers based on behavioral and demographic features, then compares outcomes. Propensity score matching yields 12x better match quality than clustering, though it tends to produce lower iROAS estimates. Better matching does not automatically mean higher iROAS. That is a counterintuitive finding that every analyst running retail media measurement should internalize.
Understanding which method your retail media network uses is not optional context. It is foundational to interpreting the number they hand you.
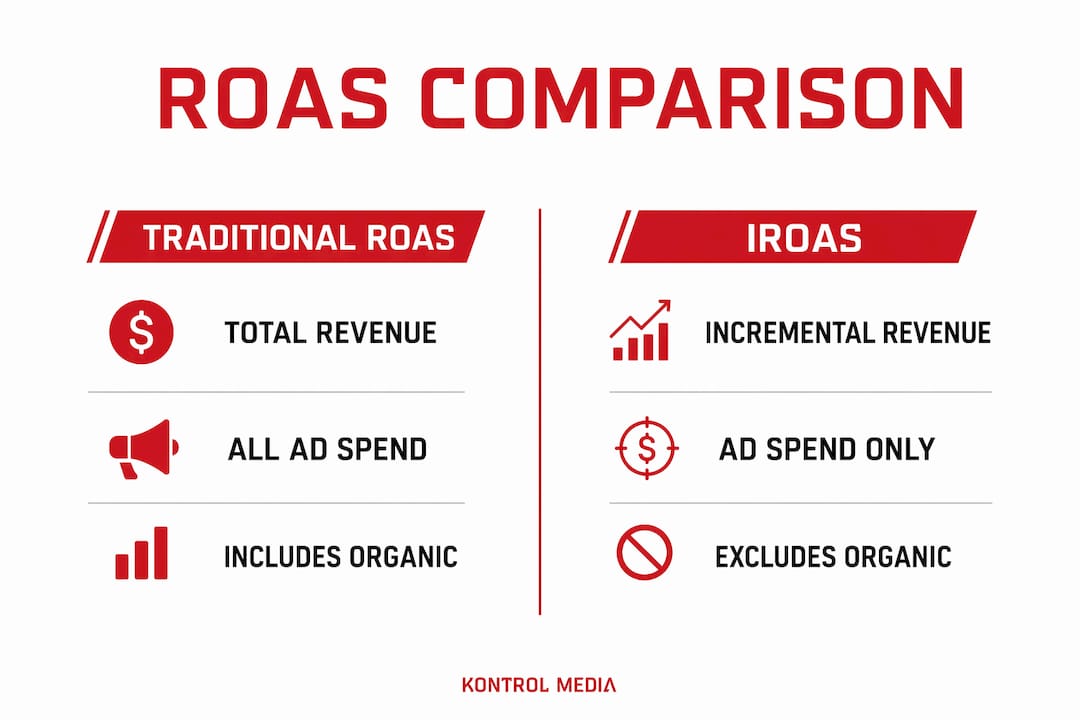
How does iROAS differ from traditional ROAS?

Traditional ROAS is defined as Total Attributed Revenue divided by Total Ad Spend. It is the metric most retail media networks report by default, and it consistently overstates channel efficiency because it includes organic conversions in the revenue numerator. A shopper who would have bought your product regardless of seeing the ad still gets counted as an ad-driven sale under traditional ROAS. That inflates the number and obscures the true causal impact of your spend.
The practical difference in reported values is striking. Branded paid search, for example, typically shows a reported ROAS of 8x to 20x. The iROAS for the same campaigns typically falls between 0.5x and 2x. Retargeting display campaigns report 4x to 10x ROAS while delivering 1x to 3x iROAS. Those ranges reveal how much of what traditional ROAS claims as ad-driven revenue is actually organic behavior wearing an attribution tag.
| Dimension | Traditional ROAS | iROAS |
|---|---|---|
| Revenue counted | All attributed revenue | Only incremental revenue |
| Organic conversions | Included | Excluded |
| Causal inference | No | Yes |
| Typical range (branded search) | 8x to 20x | 0.5x to 2x |
| Best use case | Reporting volume | Budget optimization |
Pro Tip: Never compare iROAS figures across retail media networks without first confirming they used the same measurement methodology. A 2.0x iROAS from one network and a 1.8x from another may reflect methodology differences rather than actual performance differences.
The importance of iROAS for brands advertising on retail media sites goes beyond accuracy. It directly affects budget allocation decisions. If you are optimizing spend based on traditional ROAS, you are likely over-investing in channels that capture organic demand and under-investing in channels that actually drive new purchase behavior. iROAS corrects that misallocation by anchoring your decisions to causality rather than correlation.
What methodological challenges affect iROAS measurement?
This is where the conversation gets uncomfortable, and where most retail media measurement conversations stop short. A 2026 study of 42 Albertsons campaigns found that methodology choices alone caused iROAS to vary by an average of 6.5x and flip from positive to negative in 83% of campaigns. The same campaign, measured with different methodological inputs, can look like a success or a failure depending on the choices made before the analysis even begins. That is not a measurement problem in the traditional sense. It is a transparency problem.
The four key variables that drive this variability are:
- Test and control group construction: How the holdout group is selected and sized directly shapes the baseline you measure against.
- Matching approach: Clustering versus propensity score matching versus random assignment each produce different control groups and therefore different incremental lift estimates.
- Matching features: Which data points are used to match exposed and unexposed shoppers. Including historical brand sales as a matching feature can swing average iROAS from $1.23 to negative $0.14. One feature inclusion decision produces a swing of more than a dollar per dollar spent.
- Incremental revenue computation method: The difference between observed sales comparison and Bayesian Structural Time Series can vary by up to 90% even under identical campaign conditions.
“The retail media measurement problem is more about data interpretation and transparency than about the metric itself.” — eMarketer, 2026
This is why a headline iROAS number without methodology context is nearly meaningless for cross-network comparison. Two networks reporting the same iROAS may have arrived there through entirely different analytical paths. One may have used propensity score matching with historical brand sales excluded. The other may have used clustering with brand sales included. The outputs are not comparable, but they look identical on a dashboard.
Better match-quality diagnostics belong in every marketing dashboard alongside iROAS, not buried in a methodology appendix. The standard mean difference on covariates is a concrete, reportable number that tells you how well your control group actually mirrors your exposed group. Ask for it.
How to use iROAS effectively to optimize retail media spending
Knowing the formula is the starting point. Using iROAS to make better decisions requires a framework for interpretation that accounts for the methodological context behind every number.
- Request a methodology disclosure from every retail media partner. Ask specifically: What test and control construction method was used? What matching approach was applied? Were historical brand sales included as a matching feature? What revenue computation method was used? Brands without in-house analytics capability are particularly vulnerable to accepting iROAS reports at face value without these disclosures.
- Store methodology inputs alongside iROAS outputs. Record the test/control method, matching approach, features used, and revenue model for every campaign. Storing these inputs prevents you from ranking media partners based on bookkeeping differences rather than actual incremental performance.
- Set iROAS thresholds relative to your business model, not industry averages. A consumer packaged goods brand with thin margins needs a different iROAS floor than a high-margin specialty retailer. Benchmark against your own cost of goods and contribution margin, not a generic “good iROAS” number from a trade publication.
- Combine iROAS with traditional metrics on the same dashboard. Traditional ROAS still tells you something useful about volume and attribution coverage. The two metrics together give you a fuller picture than either alone. The gap between your reported ROAS and your iROAS is itself a diagnostic signal about how much organic demand your ads are capturing versus creating.
- Normalize before comparing across networks. If you are running retail media on multiple networks and want to compare performance, you need either a shared methodology or a normalization layer. Without it, you are ranking partners on artifacts of measurement design rather than true incremental contribution.
Pro Tip: Ask your retail media partner whether their iROAS tracks new-to-SKU, new-to-brand, or new-to-category incrementality. These capture different types of incrementality and have very different strategic implications for your brand growth goals.
For food and beverage brands specifically, F&B benchmark data can help contextualize what iROAS thresholds are realistic given category margins and typical retail media CPMs. The goal is not to chase a high iROAS number in isolation. The goal is to understand whether your ad spend is generating revenue your brand would not have captured otherwise, at a cost that makes economic sense for your category.
Key takeaways
iROAS is only as reliable as the methodology behind it, which means transparency from retail media partners is not a nice-to-have. It is the foundation of any credible measurement program.
| Point | Details |
|---|---|
| iROAS definition | iROAS measures only the revenue caused by ads, excluding organic conversions from the calculation. |
| iROAS vs ROAS gap | Branded search ROAS can read 8x to 20x while the true iROAS for the same campaign falls between 0.5x and 2x. |
| Methodology variability | Methodology choices alone caused a 6.5x average iROAS swing and sign flips in 83% of campaigns studied. |
| Transparency requirement | Brands must request test design, matching approach, and revenue model details from every retail media partner. |
| Cross-network comparison risk | iROAS figures are not comparable across networks without confirming shared or normalized methodology. |
Why iROAS is the metric retail media has been waiting for, and why it still needs work
I have spent a lot of time inside retail media measurement conversations, and the honest truth is that most of them start and end with ROAS. Networks report it. Brands accept it. Agencies optimize to it. And the whole system quietly rewards whoever constructs the most favorable attribution window rather than whoever actually drove the most incremental sales.
iROAS changes that conversation, and I think that matters enormously. When a brand can look at a retail media investment and say “this ad generated $1.60 of revenue I would not have had otherwise for every dollar I spent,” that is a number worth building a budget around. It connects advertising to genuine business outcomes in a way that traditional ROAS simply cannot.
But the 2026 Albertsons research gave me pause. The finding that methodology choices alone can flip iROAS from positive to negative in 83% of campaigns is not a footnote. It is a warning that the metric can be shaped, intentionally or not, by the choices made before the analysis runs. That does not make iROAS unreliable. It makes methodological transparency non-negotiable. The 52% of brands prioritizing better measurement and transparency over standardization in the 2026 Skai x Stratably Study are pointing in the right direction. Standardization is a long road. Transparency is a conversation you can have with your media partner today.
My advice: develop enough internal analytics fluency to ask the right questions, even if you are not running the models yourself. The brands that will win in retail media over the next few years are not necessarily the ones with the biggest budgets. They are the ones that understand what their measurement is actually measuring.
— Mark Kapczynski
How Kontrol Media can help you get more from retail media measurement

Kontrol Media works directly with brands and retail media networks to build measurement frameworks that hold up under scrutiny. If you are running retail media campaigns and relying on ROAS as your primary performance signal, there is a real chance your budget decisions are being shaped by organic demand rather than true ad impact. Kontrol Media’s retail media strategy practice helps brands assess methodology, request the right disclosures from network partners, and build dashboards that surface iROAS alongside the context needed to act on it. Whether you are evaluating a single network or managing spend across multiple retail media partners, start with measuring true marketing ROI and build from there. For brands newer to retail media, the retail media strategy guide is a strong foundation.
FAQ
What does iROAS stand for in retail media?
iROAS stands for incremental Return on Ad Spend. It measures the revenue generated exclusively by advertising, excluding sales that would have occurred organically without the ad.
How is iROAS calculated?
iROAS is calculated by dividing incremental revenue by total ad spend. Incremental revenue is isolated using a holdout test, where a control group that did not see the ad is compared to an exposed group to measure the true causal lift.
Why is iROAS more accurate than traditional ROAS?
Traditional ROAS includes organic conversions in its revenue count, which overstates ad effectiveness. iROAS removes those organic sales, leaving only the revenue the ad actually caused, making it a more reliable KPI for budget decisions.
Can iROAS results be compared across different retail media networks?
Not reliably without methodology normalization. A 2026 study found that methodology choices alone cause iROAS to vary by an average of 6.5x, meaning two networks reporting similar iROAS figures may have used entirely different measurement approaches.
What should I ask my retail media partner about iROAS methodology?
Ask about the test and control group construction method, the matching approach used, whether historical brand sales were included as a matching feature, and which revenue computation model was applied. These four inputs determine the reliability and comparability of any iROAS figure you receive.
Recommended
- Retail Media Ad Sales: Strategic Guide for Marketing Pros in 2026 | Kontrol Media Consultancy
- Retail Media Strategy for Non-Retailers: 2026 Guide | Kontrol Media Consultancy
- Measuring the ROI of Your Marketing and Advertising Campaigns | Kontrol Media Consultancy
- Advertiser Acquisition Strategies for Media Networks in 2026 | Kontrol Media Consultancy