

Marketing for private equity portfolio companies is the discipline of applying capital-efficient, measurable marketing strategies to accelerate revenue growth and increase exit value within PE-owned businesses. This is not brand awareness for its own sake. It is a revenue-focused, capital allocation function where every dollar of marketing spend must connect to customer acquisition economics, pipeline velocity, and ultimately EBITDA contribution. Frameworks like RevOps, unit economics modeling, and the 100-day commercial plan are the operating language here. Tools like Salesforce CRM anchor the data infrastructure, while Gartner research consistently validates that cross-functional metric integration drives faster revenue growth. If you are a PE operating partner or portfolio company CMO, the strategies below are built for your reality.
What does marketing for private equity portfolio companies actually require?
Marketing for PE-backed businesses operates under a constraint that most brand-side marketers never face: a defined hold period, a board that reads P&L before anything else, and an exit thesis that must be supported by verifiable revenue data. The standard marketing playbook, built around brand equity and long-term awareness, does not survive contact with a quarterly board review. What survives is a marketing function that speaks the language of capital allocation, not creative output.
The recognized industry term for this discipline is value creation marketing, and it sits at the intersection of go-to-market strategy, revenue operations, and financial reporting. Most PE sponsors now treat marketing due diligence as a core part of their commercial due diligence process, examining customer acquisition costs, lifetime value ratios, and payback periods before the deal closes. That shift in scrutiny has forced portfolio company marketing leaders to operate more like CFOs than creative directors.

The practical implication is this: marketing must generate revenue legibility. Every campaign, every channel, every dollar of spend must produce data that answers one question for the board. Is this investment generating returns that justify the capital, and can we scale it?
What is a 100-day commercial plan and why does it matter?
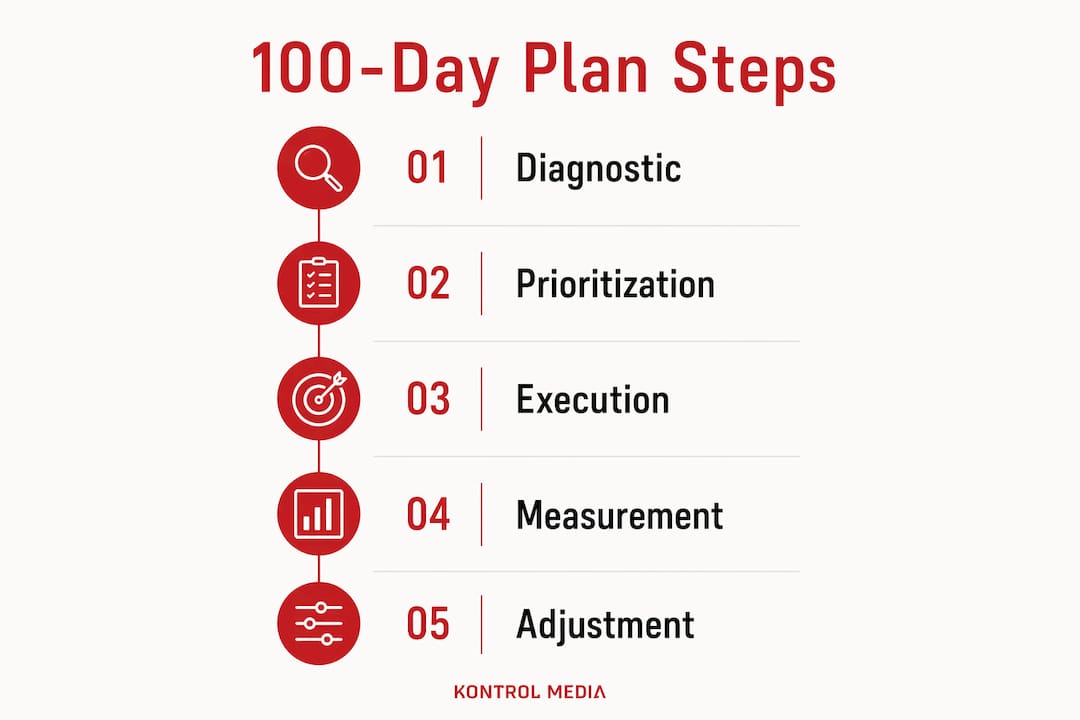
The 100-day commercial plan is the highest-leverage marketing intervention available to a PE operating partner immediately post-acquisition. It is not a strategy document that sits in a drawer. It is a phased execution framework with named owners, measurable deliverables, and P&L impact targets that arrive before the first quarterly board meeting.
The three-phase structure works as follows:
Days 1 to 30: Diagnostic. Map the existing revenue engine. Identify where leads originate, how they convert, what the sales cycle looks like, and where the data breaks down. By day 28, you should have a revenue engine map, a KPI tree with named owners, and a prioritized gap list ranked by dollar impact. This phase is about truth, not optimism.
Days 31 to 60: Install the operating rhythm. Stand up the reporting cadence. Connect Salesforce or HubSpot to marketing attribution. Define the metrics that will appear in every board deck going forward. This phase is where you install the infrastructure that makes growth verifiable rather than anecdotal.
Days 61 to 100: Execute priority initiatives. Focus exclusively on the two or three gaps with the highest dollar impact. First wins should appear by day 90 with annualized impact in the range of $200,000 to $500,000. These early wins are not just financial. They establish the marketing function’s credibility with the board.
The critical discipline in this framework is the separation of diagnostic from execution. Many marketing leaders collapse these phases and begin executing before they understand the actual revenue architecture. That produces activity without impact, which is the fastest way to lose board confidence.
Pro Tip: Resist the temptation to address every gap you find in the diagnostic phase. Prioritize the top two or three issues by dollar impact and ignore the rest until you have delivered measurable results. Breadth of activity is not the same as depth of impact.
The best practices for PE-backed CEOs reinforce this point: the first 100 days set the cultural and operational tone for the entire hold period. Marketing leaders who use this window to demonstrate rigor and financial discipline earn the latitude to invest more aggressively later.
How do you build a marketing investment thesis for PE boards?
PE boards lose confidence in marketing leaders who present activity-based reports instead of investment theses grounded in unit economics and projected returns. The fix is not a better slide deck. It is a fundamentally different framing of what marketing spend represents.
A marketing investment thesis treats spend as a diversified portfolio of capital deployed across risk and return timelines, not a line-item budget seeking approval. Here is what that thesis must contain to resonate with a PE board:
- Customer Acquisition Cost by channel and segment. Comprehensive CAC includes media spend, creative costs, personnel, and technology platforms. Not just ad spend. Boards that see only ad spend in the CAC calculation will eventually discover the full number and question every prior report.
- Lifetime Value and LTV:CAC ratio. The target ratio runs from 3:1 to 5:1, with payback periods ideally under 12 months. A payback period exceeding 24 months is a structural red flag that signals either poor targeting or unsustainable acquisition economics.
- Three investment scenarios. Present conservative, base, and aggressive cases tied to specific revenue outcomes and capital requirements. This gives the board a decision framework rather than a single number to approve or reject.
- Reporting cadence. Monthly pipeline generation metrics, quarterly LTV:CAC and payback trends, and annual marketing ROI give the board the rhythm they need to track progress without micromanaging execution.
Pro Tip: Frame marketing ROI as EBITDA contribution and revenue growth, not impressions or click-through rates. Boards think in multiples and margin. Your reporting should speak that language from the first slide.
Measuring marketing campaign ROI with this level of precision is not optional in a PE context. It is the price of admission for earning sustained investment in the marketing function.
How does revenue architecture align marketing, sales, and reporting?
Revenue architecture is the process and data design that makes growth verifiable across the full funnel, from first marketing touch to closed revenue to customer retention. It is not primarily a technology problem. It is a data alignment and process discipline problem, and most PE portfolio companies have not solved it before acquisition.
The consequence of poor revenue architecture is predictable. Sales headcount increases to compensate for what appears to be a capacity problem, when the actual problem is lead quality or targeting. Full-funnel attribution corrects this by making the relationship between marketing inputs and revenue outputs visible and auditable. That visibility is what allows a board to make an informed decision between investing in sales capacity versus improving marketing targeting.
The RevOps metrics framework spans three funnel stages:
| Funnel Stage | Key Metrics | Business Question Answered |
|---|---|---|
| Marketing | MQLs, cost per lead, marketing-sourced pipeline | Are we generating enough qualified demand? |
| Sales | Pipeline coverage, win rates, sales velocity | Are we converting demand efficiently? |
| Customer Success | Net Revenue Retention (NRR), churn rate | Are we retaining and expanding revenue? |
Companies that track cross-functional RevOps metrics see 9% faster revenue growth and 15% higher profitability compared to organizations where these functions report in silos. That is not a marginal improvement. It is the difference between a portfolio company that commands a premium exit multiple and one that leaves value on the table.
Clean CRM data is the spine of this architecture. When Salesforce pipeline data does not reconcile with marketing attribution reports, the board cannot trust either. That disconnect leads to impaired valuation multiples and costly misaligned hiring decisions. Aligning marketing and sales around a single source of revenue truth is not a nice-to-have. It is a valuation driver.
How should PE portfolio companies evaluate and optimize marketing channels?
Channel selection and optimization in a PE context is a capital allocation decision, not a marketing preference. Every channel must be evaluated on CAC by segment, payback period, and scalability, and the results must feed directly into the marketing investment thesis presented to the board.
Most PE portfolio companies underinvest in demand creation and over-index on capturing existing intent through paid search and retargeting. This produces short-term pipeline but limits growth prior to exit because the addressable market of in-market buyers is finite. A channel strategy built entirely on intent capture is not scalable.
The practical framework for channel evaluation looks like this:
- Calculate fully loaded CAC for each channel, including media spend, creative development, personnel time, and technology costs. Partial CAC calculations produce misleading payback period estimates.
- Identify concentration risk. If more than 60% of new customer acquisition flows through a single channel, the business is exposed to platform changes, cost inflation, or algorithm shifts that can materially impair pipeline overnight.
- Track payback period by channel continuously, not quarterly. A channel with a 10-month payback in Q1 that drifts to 18 months by Q3 is signaling a targeting or creative problem that needs correction before it becomes a board-level conversation.
- Segment profitability by customer type, not just channel. Some channels produce high-volume, low-LTV customers. Others produce fewer but more profitable accounts. The right channel mix depends on which customer segments align to the exit thesis.
Pro Tip: Integrate channel-level CAC and payback data directly into your board reporting. When a board can see that paid social generates a 14-month payback while content-driven inbound generates an 8-month payback, the investment decision becomes obvious. You stop defending the budget and start directing it.
Key takeaways
Effective marketing for PE portfolio companies requires connecting every dollar of spend to verifiable revenue outcomes, from the 100-day diagnostic through exit.
| Point | Details |
|---|---|
| Start with a 100-day plan | Complete a diagnostic before executing to identify the highest-dollar-impact gaps first. |
| Build a marketing investment thesis | Present CAC, LTV:CAC ratios, and three investment scenarios to earn board confidence. |
| Install revenue architecture | Align CRM data, full-funnel attribution, and RevOps metrics to make growth auditable. |
| Evaluate channels as capital | Calculate fully loaded CAC by channel and segment, and monitor payback periods continuously. |
| Frame marketing as EBITDA contribution | Boards respond to margin and multiples, not impressions. Report in their language. |
What I have learned about marketing in PE environments
I have worked with enough PE-backed companies to recognize a pattern that repeats itself with uncomfortable regularity. The marketing leader arrives post-acquisition with energy and ideas. They launch campaigns, refresh the brand, hire a demand generation team. By month six, the board is asking why pipeline has not moved. By month nine, the marketing leader is defending their existence.
The failure is almost never about the quality of the marketing work. It is about the absence of revenue legibility. The board cannot connect what marketing is doing to what the P&L is showing, and in that vacuum, skepticism fills the space.
What actually works is slower at the start and faster at the end. The 100-day diagnostic feels like it delays execution, but it produces something more valuable than early campaigns: it produces a shared understanding of where the revenue engine is broken. When you fix the right things with that understanding, the results are visible and attributable. That is what earns trust.
The other lesson I keep returning to is that marketing leaders in PE environments need to think like capital stewards, not creative directors. The question is never “what should we do?” The question is always “where does the next dollar of marketing investment generate the highest return, and how quickly?” That reframe changes everything about how you plan, report, and advocate for resources.
— Mark Kapczynski
How Kontrol Media helps PE-backed companies build marketing that performs
Kontrol Media works directly with private equity firms and their portfolio companies to design and execute marketing strategies that connect to revenue outcomes from day one. We bring the diagnostic rigor of a 100-day commercial plan, the financial discipline of a board-ready marketing investment thesis, and the operational depth to build revenue architecture that makes growth transparent and scalable.
Our clients include Experian, REMAX, West Monroe, and Enthusiast Gaming, organizations that needed marketing to perform as a business function, not a support function. If your portfolio company needs growth strategies grounded in unit economics and built for a PE hold period, we are ready to engage. Reach out to Kontrol Media to start the conversation.
FAQ
What is a marketing investment thesis for PE boards?
A marketing investment thesis presents marketing spend as a capital allocation decision with unit economics scenarios, including CAC, LTV:CAC ratios, and payback periods, rather than a line-item budget. It includes conservative, base, and aggressive investment cases tied to specific revenue and EBITDA outcomes.
What is the ideal LTV:CAC ratio for a PE portfolio company?
The target LTV:CAC ratio runs from 3:1 to 5:1, with a CAC payback period ideally under 12 months. A payback period exceeding 24 months signals unsustainable acquisition economics and is treated as a red flag during marketing due diligence.
How does RevOps support marketing for portfolio companies?
RevOps aligns marketing, sales, and customer success around shared funnel metrics and a single CRM data source, making revenue growth verifiable and auditable. Companies tracking cross-functional RevOps metrics see 9% faster revenue growth and 15% higher profitability compared to siloed organizations.
What should a 100-day commercial plan deliver?
By day 28, the plan should produce a revenue engine map, a KPI tree with named owners, and a prioritized gap list ranked by dollar impact. First measurable P&L wins should appear by day 90, with annualized impact in the range of $200,000 to $500,000.
Why do most PE portfolio companies underperform on marketing?
Most portfolio companies underinvest in demand creation and over-index on capturing existing intent, which limits growth prior to exit. Poor revenue legibility from disconnected CRM and attribution systems also leads to misaligned hiring decisions and impaired valuation multiples at exit.
Recommended
- Private Equity Marketing Due Diligence: 2026 Guide | Kontrol Media Consultancy
- Private Equity Commercial Due Diligence: 2026 Guide | Kontrol Media Consultancy
- Unlocking Business Potential: Strategic Marketing and Consulting for Growth | Kontrol Media Consultancy
- What Is Marketing-Led Growth? A Strategic Guide | Kontrol Media Consultancy