


Product-market fit shows up as behavioral dependency confirmed by data, not enthusiasm alone. The clearest product market fit signals are a 40% or higher “very disappointed” score on a properly sampled PMF survey, a retention curve that flattens instead of decaying to zero, unsolicited referrals from actual paying customers, and steady growth in customers who match your ideal customer profile. If you see two or more of these at once, you likely have real fit. If you see none, you don’t, no matter how good the pitch meeting felt.
The immediate next step: stop guessing and start instrumenting. Define your activation event, build behavior-defined cohorts, and run a properly sampled PMF survey against users who’ve actually reached core value.
Four things worth checking this week:
- Time to first value and time to core value, tracked by cohort
- Week-over-week retention curve shape, not just a single retention number
- Share of new signups arriving through referral or organic brand search
- Percentage of your paying base answering “very disappointed” on the Sean Ellis question
Key Takeaways
Product-market fit is confirmed when behavioral retention, a properly sampled PMF survey, and organic referral growth all point in the same direction at once.
| Point | Details |
|---|---|
| Combine leading and lagging signals | Use activation and referral share to form hypotheses, then confirm with retention curves and revenue data. |
| Sample the PMF survey correctly | Survey only users who reached core value, and require at least 40 to 50 qualified responses. |
| Watch for false positives | Strip out discounted cohorts and annual-plan customers before trusting a retention number. |
| Segment every result | Break survey scores and retention by ICP, channel, and cohort to find your strongest segment. |
| Re-test on a fixed cadence | Repeat the instrument, survey, segment, act cycle quarterly rather than treating one result as final. |
Table of Contents
- What Product Market Fit Signals Actually Tell You
- Leading Indicators Worth Instrumenting Today
- Lagging Indicators That Confirm Fit
- Running the Sean Ellis PMF Survey Correctly
- Reading the Qualitative Signals Behind the Numbers
- Common Measurement Mistakes That Create False Positives
- The Four-Step Playbook: Instrument, Survey, Segment, Act
- How Kontrol Media Reads Signals Before Recommending Scale
- What Market Saturation Tells You About Fit
- Why Investors Read PMF Signals as Funding Readiness
- Validating Signals With Experiments
- Ready to Turn PMF Signals Into a Growth Plan
- The Signal-First Take on Product-Market Fit
- Frequently Asked Questions
- Sources
What Product Market Fit Signals Actually Tell You
Signals fall into three buckets: qualitative (what people say), behavioral (what people do), and quantitative (what the numbers confirm at scale). Understanding product market fit starts with knowing which bucket you’re reading from, because each one answers a different question at a different speed.
Leading signals move first and move fast. Activation rate, time to first value, organic referral share, and the language customers use unprompted, these shift within days of a product change. They’re your early warning system, but they’re noisy. A spike in activation could mean better onboarding or it could mean you just attracted a wave of curious tourists who churn in week three.
Lagging signals move slower and carry more weight. Retention curves, net revenue retention, and referral-driven revenue take weeks or months to mature, but when they confirm what your leading signals suggested, you’re looking at something real rather than a fluke. The 0toPMF framework puts it plainly: leading indicators generate the hypothesis, lagging indicators confirm it.
Here’s how the two work together in practice:
- Watch activation and organic pull weekly to catch early momentum or early trouble
- Treat any single leading signal as a hypothesis, not a verdict
- Confirm hypotheses with retention curves and revenue behavior over a full quarter
- Re-test the PMF survey once your qualified user base grows large enough to segment
Pro Tip: If your leading and lagging signals disagree for more than one full cycle, don’t average them together. Investigate the gap first. It usually means your sample wasn’t qualified correctly, not that fit is somewhere in between.
Leading Indicators Worth Instrumenting Today
Time to first value is the gap between signup and the moment a user experiences the product’s core benefit for the first time. Time to core value is the gap until they experience it repeatedly enough to form a habit. Both require you to define the underlying event precisely. “Logged in” is not a value event. “Sent the first invoice” or “completed the first search that returned a result they acted on” is.
Instrument these as discrete events in your analytics stack, then build cohorts by signup week. RevenueCat’s guidance on pre-PMF metrics recommends watching activation across two or three consecutive cohorts before trusting the pattern, since a single cohort can be skewed by one marketing push or one influencer mention.
A few thresholds worth checking against your own data:
- Activation within 24 to 48 hours of signup usually beats activation that drags past a week, regardless of vertical
- If fewer than 25% of signups hit your core-value event at all, the issue is likely onboarding or targeting, not the product itself
- A rising share of new users arriving through referral links or direct brand search, rather than paid acquisition, is one of the more trustworthy early signs of pull
- Sales cycles that shorten month over month, with fewer price objections, often mean the market has started explaining the value back to you
Organic referral share is simple to track: divide signups from referral and direct/branded search by total signups, then watch the trend line over eight to twelve weeks. A flat or rising trend, even from a small base, tends to matter more than the absolute number.
Statistic Callout: The Sean Ellis benchmark of 40% “very disappointed” responses correlates with companies that went on to scale successfully, but that number only means something when your sample includes real, activated users, not everyone who ever signed up.
Lagging Indicators That Confirm Fit
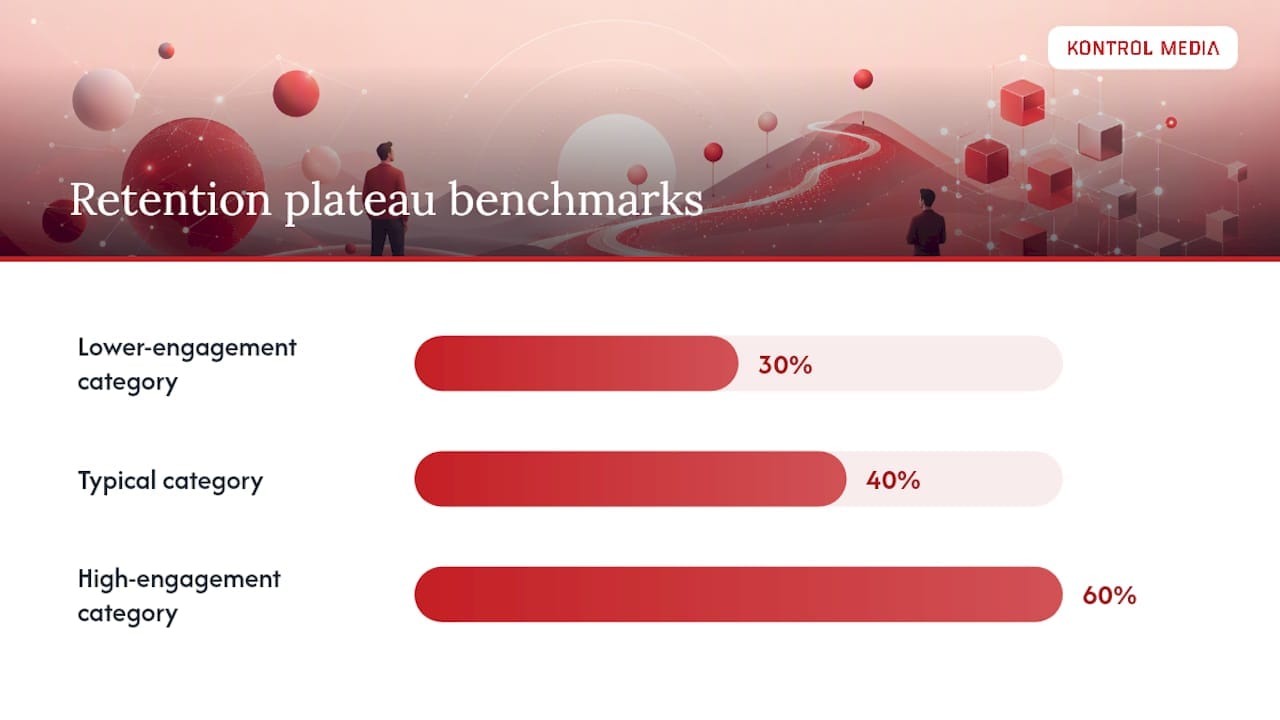
Retention curves confirm what activation only suggests. Plot the percentage of each signup cohort still active at week one, four, eight, and twelve. A curve that keeps sloping downward toward zero means you’re leaking users no matter how many new ones arrive. A curve that flattens, plateaus at 30%, 40%, or 60% depending on your category, and holds there for weeks, is one of the more reliable confirmatory signals available to any team.
For subscription businesses, net revenue retention adds a second layer of confirmation. NRR above 100% means expansion revenue from existing customers is outpacing churn, a strong sign that the product delivers enough value to justify upsells or seat growth on its own.
Later-stage teams should also watch the relationship between customer lifetime value and acquisition cost. A CLV to CAC ratio in the range PostHog and other operators point to, roughly two to three times, generally signals efficient, durable fit rather than growth propped up by overspending on ads.
| Metric | What it confirms | Watch for |
|---|---|---|
| Retention curve shape | Ongoing behavioral dependency | Flattening plateau vs. continuous decay toward zero |
| Net revenue retention | Expansion demand from existing base | NRR consistently above 100% |
| CLV to CAC ratio | Efficiency of the growth engine | Ratio holding near 2x to 3x or better over multiple quarters |
| Burn multiple | Capital efficiency relative to new revenue | Declining trend as the company matures |
Revenue growth alone can mislead you, because a well-funded sales team can force short-term revenue even when the underlying product isn’t sticky. That’s why triangulation matters: a retention curve that flattens and revenue that expands and referrals that climb together tell a far more trustworthy story than any single metric moving on its own.
- Build cohort retention curves before trusting any aggregate retention percentage
- Track NRR separately from gross new revenue so expansion and churn don’t cancel each other out invisibly
- Recalculate CLV/CAC quarterly rather than relying on a launch-day estimate
- Flag any revenue growth that isn’t accompanied by a corresponding retention or referral signal
Running the Sean Ellis PMF Survey Correctly
The question itself is simple: “How would you feel if you could no longer use [product]?” with answer options of very disappointed, somewhat disappointed, and not disappointed. Only the “very disappointed” answer counts toward the 40% benchmark. “Somewhat disappointed” respondents are not halfway to fit, they’re closer to indifferent, and lumping them in inflates your score into a false comfort zone.
Sampling rules matter more than most teams realize:
- Survey only users who’ve reached your defined core-value event, never your entire signup list
- Aim for at least 40 to 50 qualified responses before drawing any directional conclusion
- Push toward 100 or more responses once you want to segment by role, plan tier, or acquisition channel
- Re-run the survey quarterly rather than treating one result as permanent
The real value shows up in the follow-up questions. Ask “very disappointed” respondents what primary benefit they get, who else would benefit from the product, and how they first heard about it. Those answers, segmented by role and company size, start to sketch your actual ideal customer profile instead of the one you assumed at launch. A tool like LiveSession’s survey guidance is a reasonable reference for structuring the question flow without overwhelming respondents.
Pro Tip: *Don’t just report your overall PMF score. Report it by segment.
Reading the Qualitative Signals Behind the Numbers
Numbers tell you that something is happening. Interviews tell you why. A short interview script works better than a long one: ask what the user was trying to accomplish before finding your product, what they tried before, what almost made them quit, and what they’d lose if the product disappeared tomorrow. Keep sessions under 20 minutes and let silences sit instead of filling them.
Verbatim language is your most underused dataset. When customers unprompted call the product “essential” or describe a specific workaround they built around it, that language maps directly to a value hypothesis worth testing further. Support ticket themes work the same way: repeated requests to extend a specific feature usually beat a satisfaction score for revealing what’s actually driving retention.
Watch for these warning signs before you get too excited about qualitative enthusiasm:
- Praise that only shows up during a discount period or free trial extension, then disappears at renewal
- Referrals concentrated among friends of the founding team rather than strangers finding the product organically
- Interview subjects who like the idea of the product but can’t describe using it in the last week
- Support tickets asking for a feature that doesn’t exist yet, rather than defending the one that does
Unsolicited referrals, the kind where a customer brings a colleague without being asked, remain one of the hardest qualitative signals to fake.
Common Measurement Mistakes That Create False Positives
Discounts and extended trials are the most common source of false comfort. A user who signed up at 60% off or got three extra months free will often stick around longer than a full-price customer, not because the product delivers more value, but because the deal delays the decision to leave. Strip discounted cohorts out of your retention analysis before drawing conclusions.
Annual billing creates a similar illusion. A customer on an annual plan who’s quietly checked out won’t show up in your churn number until the renewal date arrives, sometimes eleven months after they stopped getting value. Track engagement independently of billing cycle so a dormant annual customer doesn’t get counted as retained.
Vanity metrics deserve outright suspicion. Downloads, follower counts, and press mentions measure attention, not dependency. None of them predict whether someone will still be using your product in ninety days.
Practical fixes worth applying immediately:
- Segment retention curves by discounted versus full-price cohorts and compare them separately
- Track product engagement events, not just subscription status, to catch quiet churn on annual plans
- Re-run your PMF survey against only qualified, activated users if your first pass mixed in casual signups
- Cross-check any survey result against your retention curve before presenting either one as confirmed fit
The Four-Step Playbook: Instrument, Survey, Segment, Act
Step one: instrument. Define your activation event and your core-value event in writing, then get engineering to log them as discrete, trackable events. Vague definitions produce vague cohorts, so specificity here saves you months of arguing about what the data means later.
Step two: survey. Run the Sean Ellis question against users who’ve hit your core-value event, not your full user list. Add the follow-up questions about primary benefit, likely referral targets, and acquisition channel so the survey does double duty as market research.
Step three: segment. Break every result, survey scores, retention curves, referral rates, by customer segment and acquisition channel. Segment-level PMF scores tell a far more strategic story than one blended number, especially when you’re deciding where to point your next quarter of spend.
Step four: act and re-test. Take your “somewhat disappointed” segment and figure out what’s missing for them specifically, then run experiments aimed at moving them into “very disappointed” territory. Set a recurring cadence, quarterly works for most teams, to re-run the whole cycle rather than treating one good survey as a permanent stamp of approval.
- Log activation and core-value events with precise, written definitions
- Field a qualified PMF survey with the standard follow-up questions attached
- Segment every result by ICP, channel, and cohort before presenting it internally
- Prioritize experiments that convert “somewhat disappointed” users, then re-test on a fixed schedule
Pro Tip: Treat the four steps as a loop, not a checklist you complete once. The teams that keep finding better fit are the ones re-running this cycle every quarter, not the ones who ran it perfectly once and moved on.
How Kontrol Media Reads Signals Before Recommending Scale
Kontrol Media treats product market fit signals as a decision gate before recommending any go-to-market investment, not as a box to check after the fact. Before advising a client to scale a channel, we insist on ICP clarity first: which segment is actually saying “very disappointed,” and does the acquisition channel we’re about to fund actually reach more of that same segment.
That discipline shapes how we’ve approached retail media and commerce network launches for clients, where activation data and early referral patterns determined which retailer partnerships were worth building out first.
A few habits worth borrowing:
- Never fund a new acquisition channel until you know which existing segment it’s meant to replicate
- Treat referral concentration as a targeting map, not just a vanity number
- Revisit the PMF gate every time you consider a new vertical, since fit in one segment rarely transfers automatically
What Market Saturation Tells You About Fit
Watching your competitive landscape matters as much as watching your own funnel. If your ideal customer segment is small and every serious competitor has already saturated it, strong internal signals can still mean a shrinking prize. Check how many other vendors are actively selling into the same segment and how long they’ve held those accounts, since a segment with heavy incumbent lock-in behaves differently than a genuinely underserved one.

A useful gut check: talk to prospects who chose a competitor instead of you. If they describe switching costs, contract terms, or integration lock-in rather than product quality, the segment might be saturated rather than poorly served. That distinction changes your roadmap entirely, pushing you toward an adjacent segment rather than a head-on feature fight.
Segment saturation also shows up in your own funnel data. If your sales cycle is lengthening and price objections are increasing even as your product improves, you may be running out of easy customers within your current ICP and need to widen the definition rather than assume the product itself has stalled. Watching category-level search demand and the number of new entrants targeting your exact niche gives you an early read on whether you’re early to a growing category or late to a crowded one.
The healthiest position combines strong internal signals with a market that still has room to grow. Strong retention paired with a saturated, shrinking niche is a warning to expand your ICP definition before doubling down on the same channel.
Why Investors Read PMF Signals as Funding Readiness
Investors treat product market fit signals as a proxy for risk, not just growth potential. A startup showing a 40% or higher Sean Ellis score, a flattening retention curve, and organic referral growth is telling investors that customer acquisition can eventually get cheaper and retention can hold as spend scales up. That combination reduces the perceived risk of writing a larger check.
The absence of these signals doesn’t automatically kill a funding conversation, but it changes what investors expect to see instead. Without confirmed fit, the pitch usually has to lean on team pedigree, market size, or early revenue momentum, and those substitutes tend to buy less patience than real behavioral evidence.
Segmented signals matter here too. A founder who can show which specific customer segment produces the strongest retention and referral behavior, rather than a single blended metric, gives investors a clearer picture of where the next round of capital should go. That specificity often matters more in due diligence conversations than the topline number alone, since it shows the team understands its own customer base well enough to make targeted bets rather than broad, unfocused ones.
Timing also plays a role. Teams that raise before establishing any of these signals often face harder terms, because the round is pricing pure execution risk on top of market risk. Teams that wait until retention and referral signals are visible, even if the absolute numbers are modest, tend to negotiate from a stronger position because the fit question is at least partially answered.
Validating Signals With Experiments
A/B testing earns its place once you have a hypothesis worth testing, not before. If your PMF survey shows a specific segment is more “very disappointed” than others, run an experiment that targets that segment’s onboarding flow specifically and measure whether activation improves relative to a control group. That’s a far more useful test than a broad, untargeted homepage experiment.
Experiment design for PMF validation works best when it isolates one variable tied to a specific signal. Testing a faster time-to-first-value flow against your current onboarding, then measuring both activation and eight-week retention across both arms, tells you whether the change actually strengthens fit or just moves a vanity metric. Running the same experiment across acquisition channels can also reveal whether a signal holds everywhere or only in the channel where you first spotted it.
Triangulation is the safeguard against false conclusions from any single experiment. If an onboarding change lifts activation but retention at week eight doesn’t move, you’ve likely optimized a leading indicator without touching the underlying behavioral dependency that actually defines fit. Pair every experiment with a follow-up PMF survey on the affected segment once sample size allows, so you’re not relying on behavioral data alone to declare victory.
Ready to Turn PMF Signals Into a Growth Plan
Confirmed product market fit signals are only valuable if they change what you do next. Once your retention curve flattens and your survey clears the 40% threshold, the real work becomes deciding which channels and partnerships can replicate that fit at scale without diluting it.
Kontrol Media works with product and growth teams on exactly that transition, translating validated fit signals into go-to-market execution across sales, marketing, and channel partnerships. If your next question is how to scale into a retail media network, a real estate advertising channel, or a broader go-to-market motion once fit is confirmed, our business strategy consulting services are built around exactly that handoff from evidence to execution. Get in touch to talk through what your signals are actually telling you.
The Signal-First Take on Product-Market Fit
Most teams treat the Sean Ellis survey as the finish line. It’s a checkpoint, not a verdict. A 40% score with no supporting behavioral data is a snapshot of sentiment, and sentiment shifts with the weather. The teams that actually scale are the ones watching activation and organic pull weekly, then using the survey to confirm a pattern they already suspected, not to discover one from scratch.
The bigger mistake I see is founders waiting for lagging signals to justify every early decision. Retention curves take months to mature. If you wait for a clean cohort chart before making any product change, you’ll ship your fixes into a market that’s already moved. Leading indicators exist precisely so you can act faster than that, with appropriate humility about how noisy they are.
Prioritize this: get your activation event defined correctly before anything else. Every other signal in this article depends on that one definition being right.
Frequently Asked Questions
What is the clearest single signal of product-market fit?
No single signal is fully reliable on its own, but a Sean Ellis survey score of 40% or higher, paired with a flattening retention curve, is the combination most practitioners trust.
How many survey responses do I need to trust a PMF score?
Aim for 40 to 50 qualified responses from users who’ve reached core value as a directional minimum, and push toward 100 or more once you want to segment by role or channel.
Can a startup have product-market fit without strong revenue?
Yes, especially early. Behavioral dependency and retention can confirm fit before monetization is optimized, though investors will eventually want to see revenue or expansion metrics as well.
Why does my retention look strong but referrals stay flat?
That gap often points to a product that satisfies existing users without generating enough excitement to talk about. Check whether your core value proposition is differentiated enough to prompt word of mouth, or whether it solves a quiet, private problem people don’t discuss.
Should I run the PMF survey again after a major product change?
Yes. Any significant change to onboarding, pricing, or core functionality can shift both your activation numbers and your survey results, so re-testing on a quarterly cadence keeps your read on fit current.
Sources
- The Sean Ellis Test: The 40% PMF Survey | Gavel
- Pre-PMF metrics: what to track before product-market fit | RevenueCat
- Product-Market Fit Indicators: Leading vs Lagging Signals | 0toPMF
- How to measure product-market fit (PMF) | PostHog