


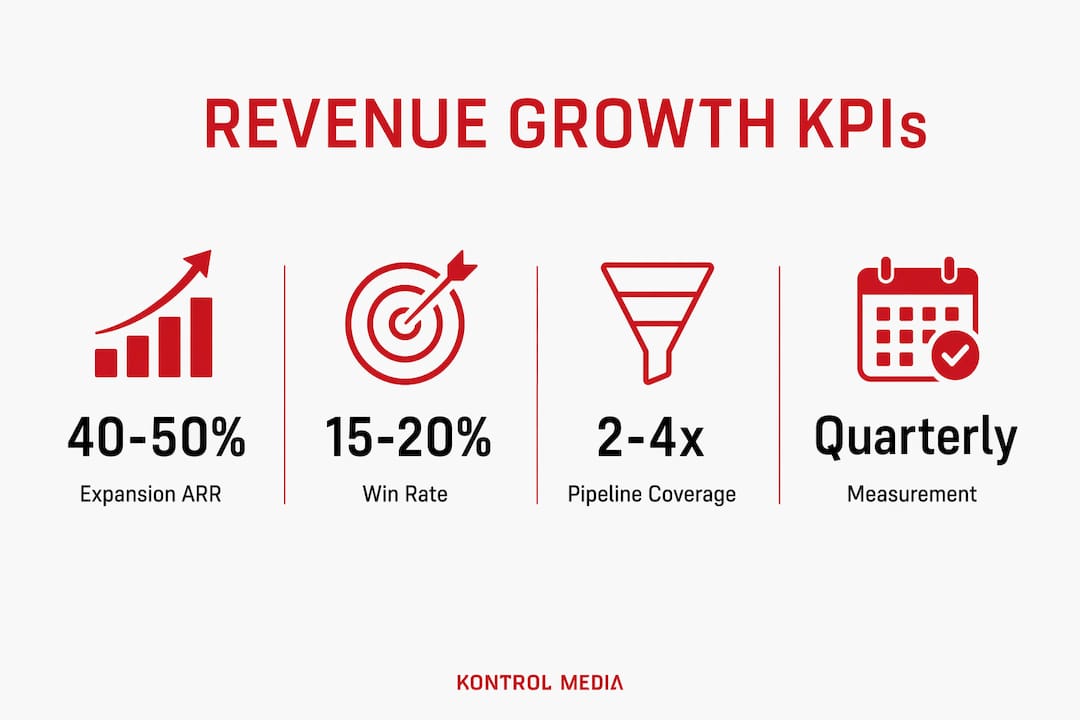
Revenue growth is defined as the percentage increase in a company’s total revenue over a specific period, reflecting both new customer acquisition and the expansion of existing accounts. For mid to large enterprises and PE-backed portfolio companies, hitting ambitious revenue targets requires more than a strong sales team. Expansion ARR accounts for 40% of total new ARR at median mature SaaS companies, rising above 50% for companies exceeding $50M ARR. That single fact reframes where growth actually comes from. The real challenge is not just setting revenue goals. It is building the architecture to reach them.
How do you accurately measure and interpret revenue growth?
Revenue growth is calculated as the percentage change in total revenue between two periods. The formula is straightforward: subtract the prior period revenue from the current period revenue, divide by the prior period revenue, and multiply by 100. What trips up most executive teams is confusing revenue growth with profit growth. Revenue growth measures the top line. Profit growth measures what remains after costs. A company can grow revenue aggressively while eroding margins, which is exactly the trap that derails many scaling enterprises.
The metrics that matter most go well beyond a single growth percentage.
| Metric | Definition | Typical Benchmark |
|---|---|---|
| Net Revenue Retention (NRR) | Revenue retained from existing customers including expansions, minus churn | 110%+ for high-growth SaaS |
| Expansion ARR | New ARR generated from existing accounts via upsells and cross-sells | 40–50% of total new ARR at mature companies |
| CAC:LTV Ratio | Customer acquisition cost relative to lifetime value | 3:1 or higher |
| CAC Payback Period | Months to recover customer acquisition cost | Under 90 days for capital efficiency |
| Pipeline Coverage Ratio | Total pipeline value divided by revenue target | 3.2x median, 4.8x top quartile |
Quarterly measurement catches problems faster than annual reviews. Annual numbers smooth over the volatility that kills forecasts. Leading indicators like pipeline coverage and MQL-to-SQL conversion rates give you a forward view. Revenue itself is a lagging indicator. By the time it moves, the decisions that caused the movement are already months old.
What proven revenue growth strategies drive results in mid and large companies?
The most durable revenue growth strategies in 2026 combine post-sale expansion, pricing model evolution, and a restructured go-to-market motion. The days of relying on a single channel or a marketing-led pipeline are over. High-growth companies are shifting from marketing-led to seller-driven pipelines and embedding AI across revenue operations for efficiency and scale. That shift is not cosmetic. It changes how pipeline is built, how deals are qualified, and how forecasts are made.

Usage-based pricing adoption in SaaS rose from 27% to 38%, increasing customer retention by 31%. Aligning price with value delivered reduces churn and creates natural expansion pathways as customers grow. That is a structural revenue advantage, not a promotional tactic.
The strategies that consistently move the needle for mid to large enterprises include:
- Expansion revenue as a primary motion. Post-sale expansion revenue is the single largest growth driver for mature SaaS businesses and should be integrated into the entire sales motion, not treated as an afterthought.
- Precise ICP targeting. Broad outreach wastes budget. Defining your ideal customer profile tightly and building messaging around documented ROI shortens sales cycles and improves win rates.
- Multithreaded enterprise sales. Single-contact deals collapse when a champion leaves. Building relationships across multiple stakeholders in an account creates resilience and accelerates expansion.
- AI-enabled pipeline management. AI tools identify deal risk, score leads, and surface next-best actions. This is no longer experimental. AI is a competitive necessity embedded throughout revenue funnel operations for top performers.
- Self-serve revenue engines. Enterprise buyers complete 70% of their evaluation before contacting sales. Self-serve content and product-led motions capture that evaluation window and contribute roughly 20% of revenue in high-growth companies.
- CAC:LTV discipline. Tracking CAC:LTV ratios above 3:1 with payback periods under 90 days keeps growth capital-efficient and investor-ready.
Pro Tip: Before adding headcount to hit a revenue target, run a pipeline coverage analysis first. If your coverage ratio sits below 3x, more sellers will not solve the problem. Fix the pipeline quality and ICP targeting before scaling the team.
For a deeper look at how SaaS sales strategy connects to revenue acceleration, the frameworks around pipeline architecture and seller productivity are worth studying closely.
How can organizations align internal teams to sustain revenue growth?
Growth without architecture creates what practitioners call “leveraged strain.” Growth initiatives without margin and operational stress testing cause leveraged strain and margin erosion, undermining durable revenue growth. The revenue number goes up. The business underneath it quietly weakens. This is the most common failure mode for companies that hit a growth target one year and miss badly the next.
The fix starts at the executive level. Unified KPIs focused on profitability, not just top-line revenue, create the right incentives across sales, marketing, finance, and operations. When sales is compensated purely on new bookings and marketing is measured on MQLs, the two functions optimize against each other. That misalignment is expensive.
The organizational changes that support sustained growth follow a clear sequence:
- Define decision rights. Every revenue-related decision needs a clear owner. Ambiguity at the leadership level creates delays and contradictory priorities at the execution level.
- Document review frameworks. Quarterly business reviews should include scenario modeling with volatility inputs, not just backward-looking performance summaries.
- Build RevOps as a connective layer. Revenue Operations aligns data, process, and technology across sales, marketing, and customer success. Without it, each function operates on different numbers.
- Stress-test growth for EBITDA impact. Growth must be stress-tested for EBITDA and operational capacity impact before scaling to avoid margin deterioration.
- Recalibrate quarterly. Market conditions shift. A strategy built in january needs a structured review by april. Scenario modeling should account for deal velocity changes, competitive shifts, and capacity constraints.
Scaling beyond $10M ARR often requires structural changes from founder-led to process-driven growth with clear roles and documentation. That transition is uncomfortable. It requires leaders to give up control in exchange for repeatability. The companies that make that shift cleanly are the ones that sustain growth at scale.
Pro Tip: Assign a single executive as the owner of the revenue growth plan, not a committee. Committees dilute accountability. One owner with cross-functional authority moves faster and creates clearer escalation paths when targets are at risk.
The sales and marketing alignment question sits at the center of this. When both functions share a unified revenue target and common definitions for pipeline stages, the friction that kills deals disappears.
What metrics best predict revenue growth in new market entries?
Revenue in a new market entry is always a lagging indicator. Pipeline coverage, win rate, and deal velocity are more reliable early health signals than revenue itself. By the time revenue confirms a market entry is working, you have already spent six to twelve months finding out. The executives who catch problems early are the ones watching the leading indicators daily.
The metrics that give you the earliest signal of GTM health include:
| Metric | Type | What It Signals | Target |
|---|---|---|---|
| Pipeline coverage ratio | Leading | Enough deals to hit target | 3.2x median, 4.8x top quartile |
| MQL-to-SQL conversion rate | Leading | Marketing quality and ICP fit | Varies by segment; track trend |
| Win rate | Leading/Lagging | Competitive positioning and deal quality | 15–20% for $100K+ ACV enterprise |
| Deal velocity | Leading | Sales cycle efficiency | Shorten quarter over quarter |
| NRR | Lagging | Retention and expansion health | 110%+ for high growth |
| CAC payback period | Lagging | Capital efficiency | Under 90 days |
Win rates for $100K+ ACV enterprise SaaS compressed from 26% in 2022 to 15–20% in 2026. That compression means pipeline coverage requirements have risen to 5–8x to reliably hit targets. If your coverage sits at 3x and your win rate is 18%, the math does not close. You need to know that in month two of a market entry, not month nine.
AI-enabled analytics now surface pipeline quality signals that human review misses. Deal engagement scores, stakeholder response patterns, and competitive displacement signals all feed into a more accurate forecast. The role of sales in SaaS growth has evolved from relationship management to data-informed pipeline stewardship. The executives who treat their CRM as a forecasting instrument, not a contact database, consistently outperform those who do not.
Leading indicators like pipeline coverage and MQL-to-SQL conversion provide early visibility into revenue growth potential ahead of lagging revenue numbers. Build a weekly dashboard around these metrics and review it with the full GTM leadership team. That cadence creates the shared situational awareness that makes proactive adjustments possible.
Key Takeaways
Sustainable revenue growth requires measuring the right metrics, aligning internal teams around shared KPIs, and building a go-to-market architecture that treats expansion revenue and leading indicators as primary inputs.
| Point | Details |
|---|---|
| Expansion ARR is the primary growth engine | Post-sale expansion accounts for 40–50% of new ARR at mature companies and must be a deliberate motion. |
| Leading indicators outperform revenue as signals | Pipeline coverage, win rate, and deal velocity reveal GTM health months before revenue numbers move. |
| Organizational alignment prevents margin erosion | Unified executive KPIs and RevOps infrastructure prevent the leveraged strain that derails growth at scale. |
| Capital efficiency is non-negotiable | CAC:LTV above 3:1 and payback under 90 days keep growth investor-ready and operationally sound. |
| AI is now a baseline requirement | Embedding AI across pipeline management and forecasting is a competitive necessity, not an optional upgrade. |
The uncomfortable truth about revenue goals in complex organizations
I have worked with enough PE-backed portfolio companies and large mid-market public companies to recognize a pattern that repeats itself with striking consistency. The CEO and CFO set a revenue target. It is ambitious, often 30–50% above the prior year. The number is real. The pressure behind it is real. But the underlying levers, the specific products, channels, pricing models, and customer segments that will actually generate that revenue, are rarely mapped out with the same rigor as the target itself.
That gap between the goal and the architecture to reach it is where growth stalls. I have seen companies with genuinely strong products miss their numbers not because the market was wrong, but because the go-to-market motion was built for a different stage of the business. Founder-led sales habits persisting into a $50M ARR company. Marketing and sales operating on different definitions of a qualified lead. Expansion revenue treated as a bonus rather than a primary motion.
The mindset shift that changes outcomes is moving from opportunistic revenue chasing to what I call engineered growth. That means stress-testing every initiative for EBITDA impact before committing resources. It means building a pipeline coverage model before hiring the next ten sellers. It means treating your ICP definition as a living document that gets sharper every quarter, not a slide from the original pitch deck.
Kontrol Media was built specifically to help companies close that gap. We dig into the business, find the pathways to new and incremental revenue that the internal team is too close to see, and build a go-to-market strategy around them. The work is specific, hands-on, and grounded in the operational realities of the business. That is the only kind of consulting that actually moves the number.
— Mark Kapczynski
Kontrol Media’s approach to driving revenue in complex enterprises
Kontrol Media works with PE-backed portfolio companies and mid-market public enterprises that carry ambitious revenue targets and need a clear path to reach them. The challenge is almost never a lack of ambition. It is a lack of architecture connecting the goal to the execution.
Kontrol Media’s business growth consulting starts by mapping the actual revenue levers available to the business, including expansion opportunities, new channel partnerships, and GTM model adjustments that internal teams often overlook. From market entry support to sales and marketing alignment, the work is hands-on and built around measurable outcomes. If your revenue target feels disconnected from your current go-to-market reality, that is exactly the conversation Kontrol Media is built for. Reach out to start the discussion.
FAQ
What is revenue growth and how is it calculated?
Revenue growth is the percentage increase in a company’s total revenue between two periods. Calculate it by subtracting prior period revenue from current period revenue, dividing by prior period revenue, and multiplying by 100.
What is the difference between revenue growth and profit growth?
Revenue growth measures the increase in total sales. Profit growth measures what remains after costs are deducted. A company can grow revenue while shrinking profits if costs rise faster than sales.
What is expansion ARR and why does it matter?
Expansion ARR is new revenue generated from existing customers through upsells and cross-sells. It accounts for 40–50% of total new ARR at mature SaaS companies, making it the primary growth engine for established businesses.
What leading indicators best predict revenue growth in a new market?
Pipeline coverage ratio, MQL-to-SQL conversion rate, win rate, and deal velocity are the most reliable early signals. Revenue itself is a lagging indicator that confirms results months after the underlying GTM decisions are made.
How do you align sales and marketing teams to support revenue growth?
Align both functions around shared revenue targets, unified pipeline stage definitions, and common KPIs like CAC:LTV and CAC payback period. RevOps serves as the connective layer that keeps data and process consistent across both teams.
Recommended
- Scaling Up: Strategies for Sustainable Business Growth | Kontrol Media Consultancy
- Maximizing Business Growth: Strategies for Success | Kontrol Media Consultancy
- Comprehensive Business & Marketing Services | Kontrol Media
- Strategies for Expanding Your Business into New Markets | Kontrol Media Consultancy