

Most marketing teams work hard at experimentation. They run tests, track results, and iterate. Yet only 20% report high impact from those efforts, and a striking 77% say winning tests fail to scale. That gap between effort and outcome is not a motivation problem. It is a structural one. A well-built growth marketing experimentation framework changes that equation by replacing guesswork with disciplined, repeatable processes that produce results you can actually act on, and build on, at scale.
Table of Contents
- Key Takeaways
- What a growth marketing experimentation framework actually is
- Preparing to experiment: data, hypothesis design, and prioritization
- Executing experiments with statistical rigor
- Verifying results and scaling what works
- My honest take on building an experimentation culture
- How Kontrolmedia helps you build this from the ground up
- FAQ
Key Takeaways
| Point | Details |
|---|---|
| Frameworks beat guesswork | A structured growth marketing experimentation framework replaces ad hoc testing with evidence-based decision making. |
| Prioritization is non-negotiable | ICE and RICE scoring can eliminate up to 70% of low-value experiments before they drain your resources. |
| Statistical rigor protects your decisions | Setting power at 80% and significance at p < 0.05 prevents costly false positives from driving strategy. |
| Data centralization multiplies impact | Teams with real-time, centralized data are more than twice as likely to achieve high-impact experimentation results. |
| Scaling requires a system, not luck | Standardized post-test reviews and a single metric that matters keep learning velocity high as you grow. |
What a growth marketing experimentation framework actually is
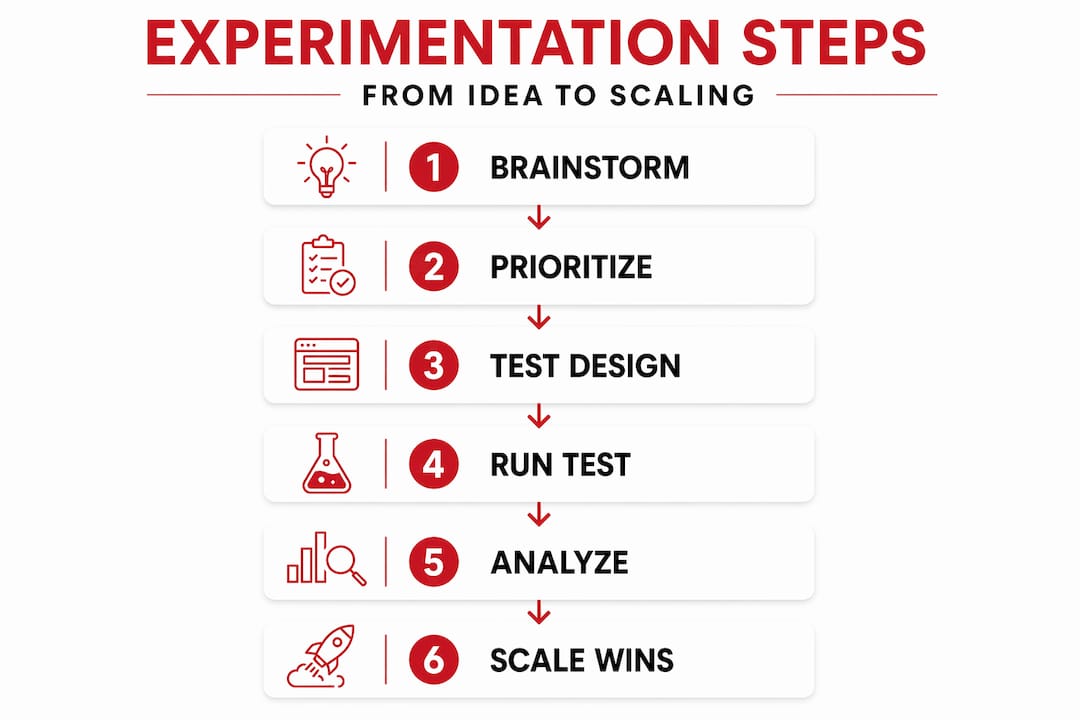
A growth marketing experimentation framework is the operating system beneath your growth marketing strategies. It defines how you generate ideas, design tests, prioritize what gets run, interpret results, and decide what scales. Without it, experimentation becomes a collection of disconnected one-off tests that produce interesting anecdotes but no compound learning.
The distinction matters because most teams already run experiments. What separates high-performing teams from the rest is the presence of a repeatable structure that makes every test a building block rather than an isolated event. Think of it as the spine of your growth function. Every decision, every sprint, every resource allocation connects back to it.
Several frameworks serve different purposes within this structure. The ICE framework (Impact, Confidence, Ease) scores experiments quickly to separate high-potential ideas from noise. RICE (Reach, Impact, Confidence, Effort) adds a reach dimension that makes it especially useful for product-led growth contexts. The Bullseye framework helps teams identify which acquisition channels deserve experimentation priority. Growth Accounting tracks user cohorts to understand where growth is actually coming from, whether that is new acquisition, retention, or resurrection. LTV:CAC ratio analysis grounds every experiment in commercial reality by tying test outcomes to unit economics.
These frameworks do not compete with each other. They layer. You might use Bullseye to pick your channel, RICE to prioritize your experiments within that channel, and Growth Accounting to verify whether your wins are durable.
Pro Tip: Start with ICE if your team is new to structured experimentation. It takes under five minutes per idea and forces the discipline of scoring before committing resources.
The deeper value of a framework is accountability. When every experiment has a pre-agreed hypothesis, a defined success metric, and a minimum detectable effect, you remove the politics from result interpretation. The data answers the question. That shift alone changes how teams operate.
Preparing to experiment: data, hypothesis design, and prioritization
Most experimentation failures happen before a single test goes live. Poor test design including vague hypotheses, insufficient duration, and absent decision rules accounts for the majority of wasted experimentation effort. Preparation is where the real work lives.
Building your data foundation
You cannot run reliable experiments on unreliable data. Fragmented data is the primary barrier to effective experimentation, not lack of effort or ideas. Before designing a single test, audit your data infrastructure. Are your acquisition, behavioral, and revenue signals flowing into a single source of truth? Are attribution windows consistent across channels? Are you measuring the same events the same way across platforms?
Teams that centralize first-party data before experimenting move faster and learn more. Real-time customer context doubles the likelihood of achieving high-impact results. That is not a marginal improvement. It is a structural advantage that compounds over every experiment cycle.
Crafting hypotheses that actually work
A strong hypothesis follows a clear format: “If we change X for audience Y, we expect outcome Z because of reason W.” The “because” is the part most teams skip, and it is the most important part. It forces you to articulate the mechanism, not just the expected result. When a test fails, a hypothesis with a stated mechanism tells you something useful. A vague hypothesis tells you nothing.
Falsifiability is equally critical. If your hypothesis cannot be proven wrong, it is not a hypothesis. It is a hope. Define what a negative result looks like before you run the test, not after.
Prioritizing with ICE and RICE
ICE scoring can eliminate 70% of low-value experiments quickly, freeing your team to focus on the tests most likely to move the needle. Score each idea on a 1 to 10 scale across Impact, Confidence, and Ease, then average the scores. Ideas below a threshold, say 6.0, get killed without debate. This is not ruthlessness. It is respect for your team’s time and your company’s resources.
RICE adds a fourth dimension, Reach, which prevents teams from over-indexing on high-effort experiments that affect a small user segment. An experiment that scores high on Impact but reaches only 2% of your audience may rank below a moderate-impact test that touches 60% of users. The math surfaces the right priority.
Pro Tip: Run a weekly prioritization session where every new experiment idea gets scored before it enters the backlog. Ideas that do not get scored do not get built. That rule alone eliminates the “good idea graveyard” most teams accumulate.
Executing experiments with statistical rigor
Designing a test well is a separate skill from having a good idea. Statistical rigor is what separates experiments that produce trustworthy decisions from ones that produce compelling stories that later fall apart.

Start with sample size and duration. Before launching any test, calculate the minimum sample size required to detect your minimum detectable effect at 80% statistical power and a significance threshold of p < 0.05. Running a test that is underpowered from the start means you will either miss real effects or over-interpret noise. Neither outcome serves you.
Set your test duration based on full business cycles, not just when you hit your sample size target. A test that reaches statistical significance on a Tuesday afternoon may look very different by Sunday evening when weekend behavior shifts the data. Running for at least one to two full weeks, and ideally two to four, protects against day-of-week bias and seasonal fluctuations.
The most common execution error is premature stopping, also called peeking. Checking results daily and stopping the moment you see a positive signal inflates your false positive rate dramatically. Decide your end date before the test starts, and commit to it. If you need to monitor for safety reasons, use sequential testing methods that account for repeated looks at the data.
When running multiple experiments concurrently, apply a Bonferroni correction or a similar adjustment to your significance threshold. Running ten tests simultaneously at p < 0.05 means you should expect at least one false positive by chance alone. The correction recalibrates your threshold to maintain the integrity of your overall program.
Finally, distinguish between statistical significance and practical significance. A result can clear the p < 0.05 bar and still represent a negligible effect size that does not justify the cost of implementation. Always evaluate Cohen’s d or a comparable effect size metric alongside your p-value. A 0.3% lift in conversion rate on a low-volume page is statistically real and practically irrelevant. Your success criteria should define both thresholds before the test launches.
Pro Tip: Build a pre-test checklist that requires every experiment to document sample size, duration, significance threshold, minimum detectable effect, and primary metric before it goes live. If any field is blank, the test does not launch.
Verifying results and scaling what works
Winning a test is not the same as creating durable growth. 77% of marketers report that winning tests sometimes fail to scale, and the reasons are consistent and preventable.
The most common scaling failure is context dependency. A test that wins in one channel, one geography, or one user segment may not generalize. Before scaling, ask whether the conditions that produced the win are replicable at larger volume. Segment your results by device, channel, user tenure, and acquisition source. If the lift concentrates in a narrow slice of your audience, your “winner” may be a local optimum, not a universal truth.
Post-test documentation is the infrastructure of learning. Every completed experiment should produce a standardized record that includes the hypothesis, methodology, results, effect size, confidence level, and a clear recommendation. This repository becomes the institutional memory that prevents teams from re-running experiments that have already been answered and from repeating design mistakes that have already been identified.
Qualitative data belongs in this process too. Quantitative results tell you what happened. Customer interviews, session recordings, and survey responses tell you why. Integrating both layers produces richer hypotheses for your next round of experiments and catches edge cases that the numbers obscure.
For scaling decisions, high-growth teams prioritize fast campaign activation and maintain a clear hierarchy of metrics. The “one metric that matters” (OMTM) approach, combined with regular growth meeting rhythms, keeps the team aligned on what scaling actually means in commercial terms. A weekly growth review where every experiment outcome is assessed against the OMTM prevents the drift toward vanity metrics that plagues teams without this structure.
| Scaling check | What to examine |
|---|---|
| Audience breadth | Does the lift hold across segments, or is it isolated to one group? |
| Channel replicability | Can the winning mechanic be deployed across other acquisition channels? |
| Effect size durability | Does the lift persist after novelty effects fade, typically beyond week two? |
| Infrastructure readiness | Does your tech stack support the winning variant at full scale? |
| Commercial impact | Does the effect size translate to meaningful revenue at target volume? |
My honest take on building an experimentation culture
I’ve watched teams invest months into experimentation programs that produce dashboards full of completed tests and almost no measurable business impact. The pattern is almost always the same. The team is running experiments, but they are optimizing for the wrong things. They are chasing statistical wins on metrics that do not connect to revenue, and they are treating every positive result as a green light to scale without asking whether the effect is real at volume.
The shift that actually changes outcomes is moving from vanity metrics to what I call “revenue-adjacent” metrics. Not just conversion rate in isolation, but conversion rate multiplied by average order value, retention cohort behavior, and LTV trajectory. When you measure marketing ROI through that lens, the experiments you prioritize look completely different.
I’ve also found that the teams who scale experimentation fastest are not the ones with the most sophisticated tools. They are the ones with the most disciplined documentation habits. When every experiment is recorded with the same structure, institutional knowledge compounds. New team members get up to speed faster. Repeated mistakes disappear. The learning curve flattens because the organization is genuinely learning, not just running tests.
The hardest conversation I have with clients is about killing beloved experiments. Every team has a test that “almost worked” and gets re-run in slightly different form every quarter. The discipline to score it honestly, recognize it as low-value, and redirect that energy toward higher-potential ideas is what separates teams that grow from teams that stay busy. Patience and rigor are not opposites of speed. They are what make speed sustainable.
— Mark
How Kontrolmedia helps you build this from the ground up
Building a growth marketing experimentation framework from scratch is genuinely hard work. The data infrastructure, hypothesis discipline, prioritization rigor, and scaling judgment all have to develop in parallel, and most teams are trying to do it while also hitting quarterly targets.
Kontrolmedia works with businesses at every stage, from early-stage startups finding their first repeatable growth channel to established enterprises whose marketing strategies have drifted out of alignment with their growth goals. The approach is hands-on and specific. We do not hand you a framework document and wish you luck. We work inside your data, your team rhythms, and your commercial context to build experimentation systems that produce results you can measure and scale. Clients like BuzzFeed and Remax have used this methodology to regain market visibility and drive customer acquisition in markets where generic approaches stopped working. If you are ready to move from scattered testing to sustainable growth systems, Kontrolmedia is the partner that makes that transition practical.
FAQ
What is a growth marketing experimentation framework?
A growth marketing experimentation framework is a structured system for generating, prioritizing, executing, and scaling marketing experiments. It replaces ad hoc testing with repeatable processes that produce compound learning and evidence-based growth decisions.
How do ICE and RICE differ in experiment prioritization?
ICE scores ideas on Impact, Confidence, and Ease, making it fast and accessible for most teams. RICE adds a Reach dimension, which prevents over-investment in high-effort tests that affect only a small portion of your audience.
What statistical standard should marketing experiments meet?
The industry standard is a 95% confidence level, equivalent to p < 0.05, with at least 80% statistical power. Always evaluate effect size alongside p-values to confirm that a statistically significant result is also commercially meaningful.
Why do winning tests fail to scale?
Most scaling failures trace back to context dependency, where a test wins in a narrow segment or channel and does not generalize, or to effect sizes that are too small to produce meaningful revenue impact at full volume. Segmenting results before scaling catches both problems early.
How many experiments should a growth team run at once?
There is no universal number, but running multiple concurrent tests requires multiple testing corrections like Bonferroni adjustments to prevent false positives. Most teams benefit more from running fewer, better-designed experiments than from maximizing test volume.
Recommended
- Key Takeaways from Possible 2026 in Miami That No Slide Deck Could Have Told Me | Kontrol Media Consultancy
- Crafting an Effective Marketing Strategy: From Research to Execution | Kontrol Media Consultancy
- Unlocking Business Potential: Strategic Marketing and Consulting for Growth | Kontrol Media Consultancy
- Scaling Up: Strategies for Sustainable Business Growth | Kontrol Media Consultancy