


CMOs should measure revenue and business outcomes, not impressions, and report a focused shortlist of outcome metrics backed by incrementality testing and ROMI analysis. We lay out that shortlist, the measurement methods that make it defensible, and a one-page report you can bring to your next leadership meeting. Impressions describe activity. Revenue describes whether marketing worked.
TL;DR:
- Choose five to seven metrics: B2B teams with long sales cycles prioritize pipeline, CAC, and CLV; short cycle businesses emphasize conversion, marginal ROMI, and retention.
- Use holdout experiments to establish causal lift, validate attribution against their results, and reserve periodic econometric analysis for long term and offline effects.
- A page for the board should show targets, recent trends, dollar impact, measurement method, confidence, and the next decision; tailor review cadence to each audience.
- Unify customer and campaign identifiers across advertising, analytics, CRM, and finance, then standardize tags and definitions before comparing channel results.
- Compare CAC with CLV by acquisition source, state the value horizon and method, and label estimates for newer customer groups as forecasts.
Table of Contents
- Which 5–7 metrics will leadership actually accept?
- How do you measure contribution: incrementality, ROMI, and attribution?
- What does a board-ready one-page report look like?
- Which fixes make your numbers reliable?
- What do revenue-driven marketing transformations look like in practice?
- What role do technology and tools play in tracking revenue?
- What are the best practices for aligning marketing teams around revenue goals?
- How do you bring customer lifetime value into marketing measurement?
- How do you build collaboration between marketing, sales, and finance?
- Why this shift is urgent: an author’s perspective
- Where does Kontrol Media help marketing leaders prove revenue impact?
- FAQ
- Sources
Which 5–7 metrics will leadership actually accept?
Most reporting dashboards are built to “flatter rather than inform”, and the fix is a short list of outcome metrics that correlate with revenue, retention, and cost efficiency. Seven candidates cover most businesses:
- Net marketing contribution: revenue attributable to marketing, times gross margin, minus marketing spend. It answers the CFO’s question: did marketing make money? Review it quarterly.
- Marginal ROMI: the return on the next dollar, not the average dollar. It tells you where to add or pull budget. Review it monthly.
- Customer acquisition cost (CAC): fully loaded spend to win one customer. It answers whether growth is affordable. Monthly.
- Customer lifetime value (CLV): margin a customer generates over the relationship. It answers whether acquisition cost is justified. Quarterly.
- Revenue-tied conversion rate: conversion measured to closed revenue, not to a form fill. It answers whether demand turns into sales. Weekly or monthly.
- Retention and churn: the share of customers who stay. It answers whether growth is durable. Monthly.
- Pipeline influenced: qualified pipeline where marketing played a verified role. It answers the CRO’s question about sales support. Monthly.
You do not need all seven. Pick five to seven that fit your model. B2B teams with long sales cycles lean on pipeline influenced, CAC, and CLV, because closed revenue arrives months after the spend. B2C and short-cycle businesses can lean on revenue-tied conversion, marginal ROMI, and retention, which move fast enough to steer weekly decisions.
Retention deserves more weight than it usually gets. A partner guide on customer retention is a useful reference if you want to build that metric into your plan.
The measurement gap is real. Only 52% of CMOs and senior marketing leaders can prove marketing’s value and receive credit for its contribution to business outcomes. A short, honest list is how you join that group.
How do you measure contribution: incrementality, ROMI, and attribution?
Start with causality. Incrementality measurement quantifies marketing’s causal contribution to outcomes, which is why it is a leading method for proving value and protecting budgets. In practice, that means experiments: hold out a region, audience, or channel, compare results against the exposed group, and read the gap as the lift marketing created. Use it when a channel claims large credit and the stakes of being wrong are high. Our primer on incrementality in retail media shows how this plays out when the media is sold, not just bought.
ROMI converts that lift into the language finance trusts. The American Marketing Association’s guidance calculates it on net marketing contribution: the revenue increase due to marketing times gross margin, minus the marketing investment, divided by the marketing investment. The same guidance warns against hunting for one universal number. Focus on what drives ROMI up or down in your business.
Simple attribution deserves suspicion. Last-click hands all credit to the final touch, and basic multi-touch models spread credit by rules that nobody has validated. Both can look precise while misleading you about what caused the sale.
A defensible stack combines:
- Experiments as the source of truth for causal claims.
- Validated attribution for day-to-day optimization, calibrated against experiment results.
- Periodic econometric analysis to capture long-run and offline effects.
Pro Tip: Run one holdout test on your largest channel before your next budget review. A single clean result will change the conversation more than a dozen dashboard screenshots.
What does a board-ready one-page report look like?
Strategy is half the job. The other half is translation. Marketing leaders build trust with non-marketers by tailoring KPIs, simplifying complex data, and telling a data-driven story. One page is enough if it holds these elements, in this order:
Headline outcome metrics, shown against target.
2. The trend over the last several periods.
3. Estimated revenue impact, stated in dollars.
4. The measurement method and your confidence in it.
5. Next steps and the decision you need from the room.
Translate every marketing statistic into a business consequence. “Click-through rate is up” becomes “we acquired customers at a lower cost, saving enough to fund the next test.” “Impressions grew” becomes nothing at all, because it does not belong on the page.
| Audience | What they want first | Cadence |
|---|---|---|
| CFO | Net marketing contribution and marginal ROMI | Monthly |
| CRO | Pipeline influenced and revenue-tied conversion | Weekly or monthly |
| Board | Revenue impact, CAC, and CLV trends | Quarterly |
Handle mixed results plainly. State what missed, why you think it missed, and what you will test next. Leaders forgive a miss that comes with a diagnosis. They do not forgive a dashboard that hid it. For more on defining the underlying numbers, see our piece on measuring the ROI of marketing and advertising campaigns.
Which fixes make your numbers reliable?
Good metrics fail on bad data. Disorganized, inconsistent marketing data prevents reliable attribution, and consistent metadata, naming conventions, and taxonomy are what let measurement scale. If two teams tag the same campaign differently, no model can reconcile the result. If an event means one thing in the web analytics tool and another in the CRM, an experiment’s readout becomes a debate about definitions.
These actions fix most of the damage:
- Unify customer and campaign identifiers across ad platforms, analytics, CRM, and finance systems.
- Enforce tagging discipline with a naming standard and a check before any campaign launches.
- Publish a shared KPI glossary so “lead,” “qualified,” and “customer” mean one thing everywhere.
- Set service levels between marketing, analytics, and finance for data delivery and issue resolution.
Pro Tip: Start with the glossary. It costs a few meetings, and it removes the arguments that stall every later measurement project.
Governance only sticks when incentives match. Give marketing, sales, and finance shared revenue targets and a joint review cadence, so nobody can win by optimizing their own slice at the expense of the number everyone is judged on.
What do revenue-driven marketing transformations look like in practice?
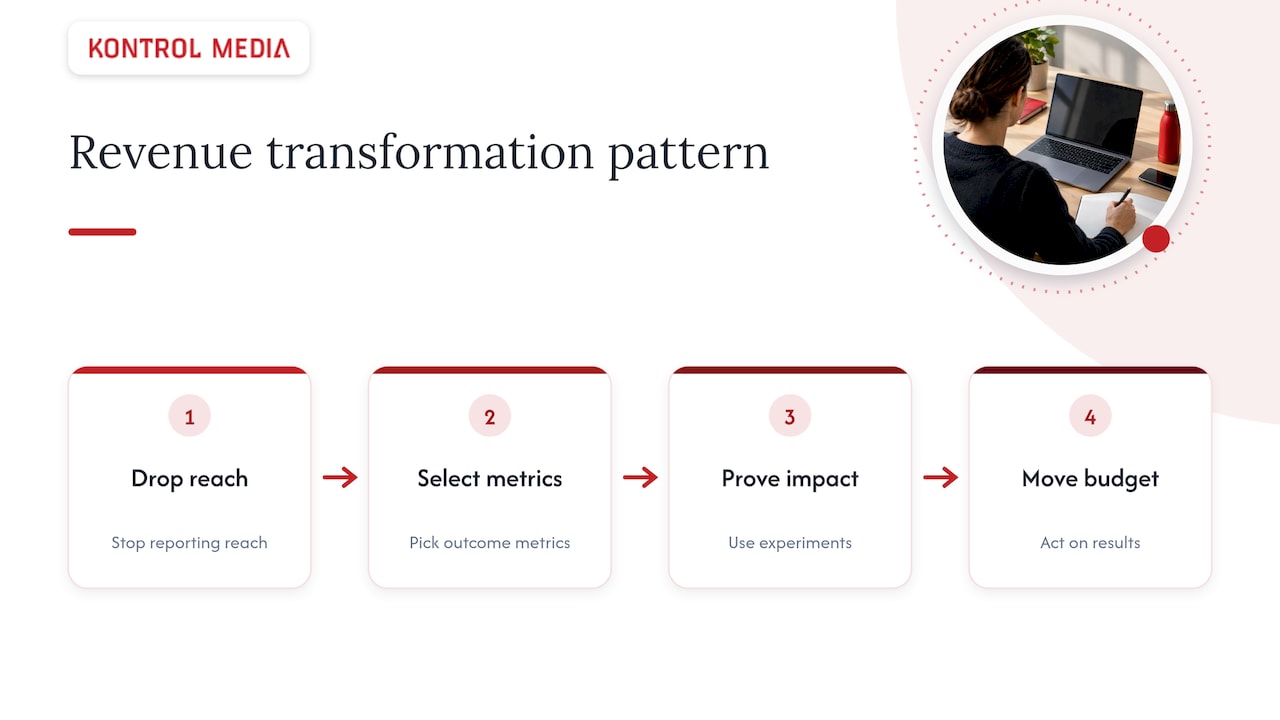
The pattern repeats across industries. A team stops reporting reach, picks a handful of outcome metrics, proves a few of them with experiments, and uses the results to move budget. Here are some ways it takes shape in our own work.
In retail and commerce media, the shift is from selling impressions to selling measurable sales impact. We build and operate networks, which is why sponsorships there must prove impact before renewal. When the network can show lift, the advertiser keeps spending. When it cannot, it loses the budget.
In channel marketing, brands reach home buyers and homeowners through real estate agents, with partnerships structured around revenue outcomes. Measurement follows the money, from agent-delivered programs to closed transactions, not from reach to applause.
In partnership development, the discipline is a time-boxed proof. Our approach to media partnership development asks leaders to prove partnership impact promptly, so weak deals end early and strong ones earn more investment.
The common thread is not a tool or a channel. It is a willingness to let a test decide. For a broader view of how these moves fit together, our overview of growth marketing frameworks CMOs use to drive revenue maps the tactics to a roadmap. We are not publishing client revenue figures here, because the principle travels better than any single result.
What role do technology and tools play in tracking revenue?
Tools do not create revenue accountability. They carry it. The question for any tool is whether it connects spend to closed revenue or stops at exposure.
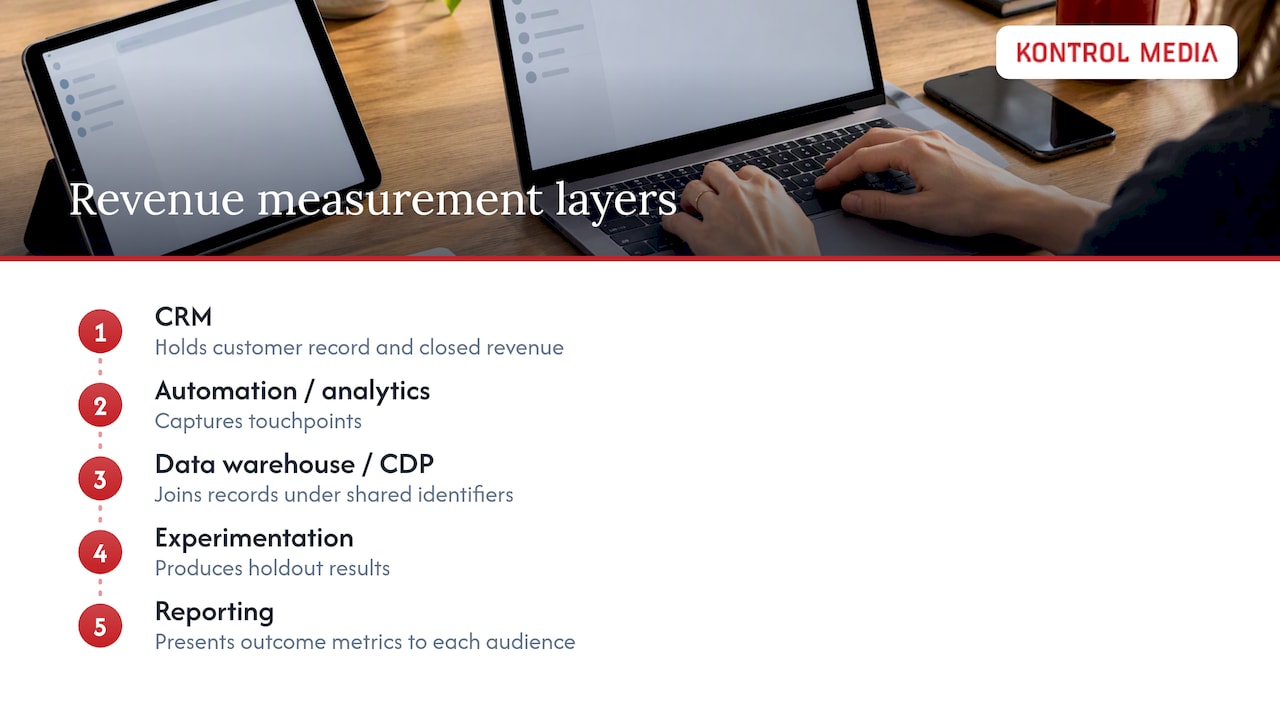
The stack that does the job has a few layers. A CRM holds the customer record and the closed revenue. A marketing automation or analytics layer captures the touchpoints. A data warehouse or customer data platform joins them under shared identifiers. An experimentation capability, whether built in-house or inside a platform, produces the holdout results. A reporting layer then presents the handful of outcome metrics to each audience.
Impression-era tooling was built to count ad delivery, and it counts it well. It was never designed to answer whether a sale would have happened anyway. That gap is why Gartner’s guidance stresses that without reliable metrics and measurement systems, CMOs cannot communicate marketing’s value or make informed strategic decisions. Establishing metrics and management systems is what aligns the function to business objectives.
Buy for integration, not features. A modest tool that shares identifiers with your finance system beats an advanced one that lives in a silo. Before you add anything new, ask three questions. Can it tie to revenue? Can finance audit it? Can it support an experiment? If the answer to any is no, it is a reporting accessory, not a measurement system.
What are the best practices for aligning marketing teams around revenue goals?
Alignment starts with what people see every day. If the team dashboard leads with impressions, the team optimizes for impressions. Move revenue-linked metrics to the top and demote reach metrics to diagnostics.
Then cascade the goal. Each channel owner should be able to say how their work connects to one of your five to seven outcome metrics, and which test would prove it. A paid media manager might own marginal ROMI and CAC. A lifecycle marketer might own retention and CLV. A content lead might own pipeline influenced. Clear ownership prevents the common failure where everyone claims the win and nobody owns the miss.
Reward learning as well as results. A well-designed experiment that kills a favorite channel is a success, because it freed budget. Teams that fear bad news stop running tests, and then your measurement stack goes quiet.
Finally, frame the work as an investment. As the AMA’s metric guidance notes, presenting marketing as an investment and matching metrics to business priorities matters as much as data accuracy. Industry commentary makes the same case: CMOs are being asked to own revenue and growth, not only brand and reach. We cover that shift further in why CMOs must now own growth and revenue outcomes.
How do you bring customer lifetime value into marketing measurement?
CAC alone can mislead. A channel that wins cheap customers who leave quickly looks efficient until you look at what those customers are worth. CLV is the corrective, and pairing it with CAC turns acquisition from a cost question into an investment question.
Three moves put it to work. First, segment CLV by acquisition source, so you can see which channels bring customers who stay and spend. Second, compare CAC and CLV by segment, and shift budget toward sources where the gap is widest. Third, report CLV with a stated horizon and method, because a figure with no assumptions behind it invites a challenge from finance.
Retention is the lever that moves CLV most reliably. The Content Marketing Institute notes that retaining existing customers costs far less than acquiring new ones, and that shifting strategy toward customer delight and retention can raise lifetime value while easing acquisition pressure. Successful organizations, in the institute’s framing, treat content as a profit center by prioritizing retention and audience value over raw traffic.
Be cautious with early CLV estimates. For newer customer cohorts, treat the number as a forecast, label it as one, and update it as real behavior comes in. A conservative, transparent CLV earns more credibility than an optimistic one that has to be walked back.
How do you build collaboration between marketing, sales, and finance?
Revenue accountability is a team sport, and the steps are practical.
- Agree on definitions first. Sit marketing, sales, and finance in one room and settle what counts as a qualified lead, an opportunity, and a customer. Write it down in the shared glossary.
- Set shared targets. Give all three functions a common revenue or pipeline goal, with each owning a visible part of it.
- Give finance a seat in the method. Invite finance to review your ROMI calculation and experiment design before results arrive. A number finance helped build is a number finance defends.
- Meet on a fixed cadence. A monthly joint review of the one-page report keeps problems small and surfaces handoff failures between marketing and sales.
- Close the loop on lead quality. Sales feedback on which leads convert should flow back into targeting and scoring, not die in a CRM note.
The payoff of this work is concrete. We explore the commercial side in our analysis of how marketing and sales alignment drives revenue growth. Where a company lacks the internal capacity to run these functions together, we also work as an extension of the team, a model we describe in your sales function, without the headcount.
Why this shift is urgent: an author’s perspective
The pattern is consistent. Marketing teams that report impressions get treated as a cost to trim. Teams that report revenue impact, with honest confidence levels, get treated as a growth lever. The shift is urgent because budgets tighten first around anything leadership cannot connect to money.
Start small. Pick one channel, run one holdout test, and put the result on a single page. Revenue-focused tactics such as retail and commerce media networks and partnership-driven channel strategies work because they carry measurement in their design. Treat early experiments and the one-page report as your first wins, since they build the credibility every later request depends on.
— Mark Kapczynski
Where does Kontrol Media help marketing leaders prove revenue impact?
You can run this playbook alone, and some teams do. When you want hands-on help, we pair business strategy with execution across marketing, sales, and business development, so the metrics you choose connect to the work that moves them. We build and operate retail and commerce media networks, run media partnership programs, and help brands reach home buyers and homeowners through the real estate channel. If a shortlist of outcome metrics and a board-ready report are your next step, explore our business strategy, marketing, and sales services or contact us to book a conversation about your measurement priorities.
FAQ
What is the 3-3-3 rule for marketing?
There is no single official 3-3-3 rule, and definitions vary by team. A common version asks you to define three audiences, three messages, and three channels, then test each combination. Treat it as a planning habit, not a measurement standard.
Which strategy creates valuable content to attract and retain customers?
Content marketing. The Content Marketing Institute describes it as a strategic approach to creating valuable, relevant, and consistent content to drive profitable customer action.
Does word of mouth count as marketing?
Yes, as an earned channel, though it is hard to measure directly. You can estimate its effect through referral tracking, customer surveys, and holdout comparisons, then report its contribution to revenue like any other source.
What does the 70:20:10 rule mean in advertising?
It is a budgeting heuristic, not a measured standard. Use it as a starting frame, then let incrementality results adjust the split.
What is the first step in replacing impressions with revenue metrics?
Choose five to seven outcome metrics and agree on their definitions with finance and sales. Then run one incrementality test on your largest channel to establish a defensible baseline.
Sources
- The Marketing Metric Survival Guide (No Statistics Required)
- Prove the Value of Marketing and Get Credit